
“Trust is like the air we breathe—when it’s present, nobody really notices; when it’s absent, everybody notices.”
Imagine this: You’re on a rickety bridge. You don’t know who built it. There are no handrails. A foggy drop below. Would you cross?
Now imagine your best friend built that bridge. Or your parent. Or an engineer who’s shown you every calculation. Feels different, doesn’t it?
That’s trust. Not logic. Not data. A feeling—a leap, a breath, a gut-level, yes!
We often assume people make decisions rationally—compare policies, check premiums, read fine print. But in reality? People decide whom to trust first, and only then justify their decision. It’s backward from what we’d like to believe. And nowhere is this truer than in insurance.
Because let’s face it: insurance is a strange product. You pay for something hoping never to use it. And when you do need it—when the accident happens, or the illness hits—your trust is put to the test.
So how do we earn that trust?
At Digit, we start with something simple, but surprisingly powerful: a question. What’s good for the customer?
It’s not a marketing trick. It’s a behavioural design principle. Framing every decision from the customer’s perspective shifts our defaults. It nudges us towards empathy, clarity, and fairness. And it helps us override our own biases—like loss aversion or blame avoidance—that often trip up institutions.
This question also gave rise to our Transparency Report.
We realized: trust isn’t built just through polished ads or big promises. It’s built in the messy moments—when claims are delayed, when outcomes aren’t perfect, when people need answers, not spin.
So, in our 12th Transparency Report, we chose to do the uncomfortable thing: we showed you everything. Not just the wins; also, the delays. The errors. The edge cases. Because transparency isn’t just about information—it’s about the intent. In behavioural terms, we’re trying to reduce the ambiguity effect—the discomfort people feel when information is incomplete. And counteract the trust asymmetry—the fact that one small failure can outweigh years of good experience.
Why go through all this?
Because trust isn’t a feature. It’s the ecosystem. It’s the bridge, the air, the reason people choose you when it really matters. And in insurance, that’s everything.
REDEFINING CLAIMS TRANSPARENCY:
UNPACKING DATA YOU MUST SEEK FROM YOUR INSURERS
As a customer, claims payment matters the most to you. That’s why we will break down our claims data as much as possible to give you a clear picture of our swift claims’ world! But why do this?
Because it’s everything we would want to see if we were an insurance customer. Next time, when someone tries to sell you insurance, we want you to seek all these important data points before you pick your insurer.
Let’s take you one by one through different alleys of Claims Street.
OPEN VAULT: OUR CLAIMS SETTLEMENT RATIO IN FY25
Claims Settlement Ratio is the one number you’re most likely to look for. So, let’s start with that. You can see our consistent CSR across two years. You can also see historically what our CSR has been every quarter.^^
Here is a look at Digit’s Claims Settlement Ratio across various LOBs:
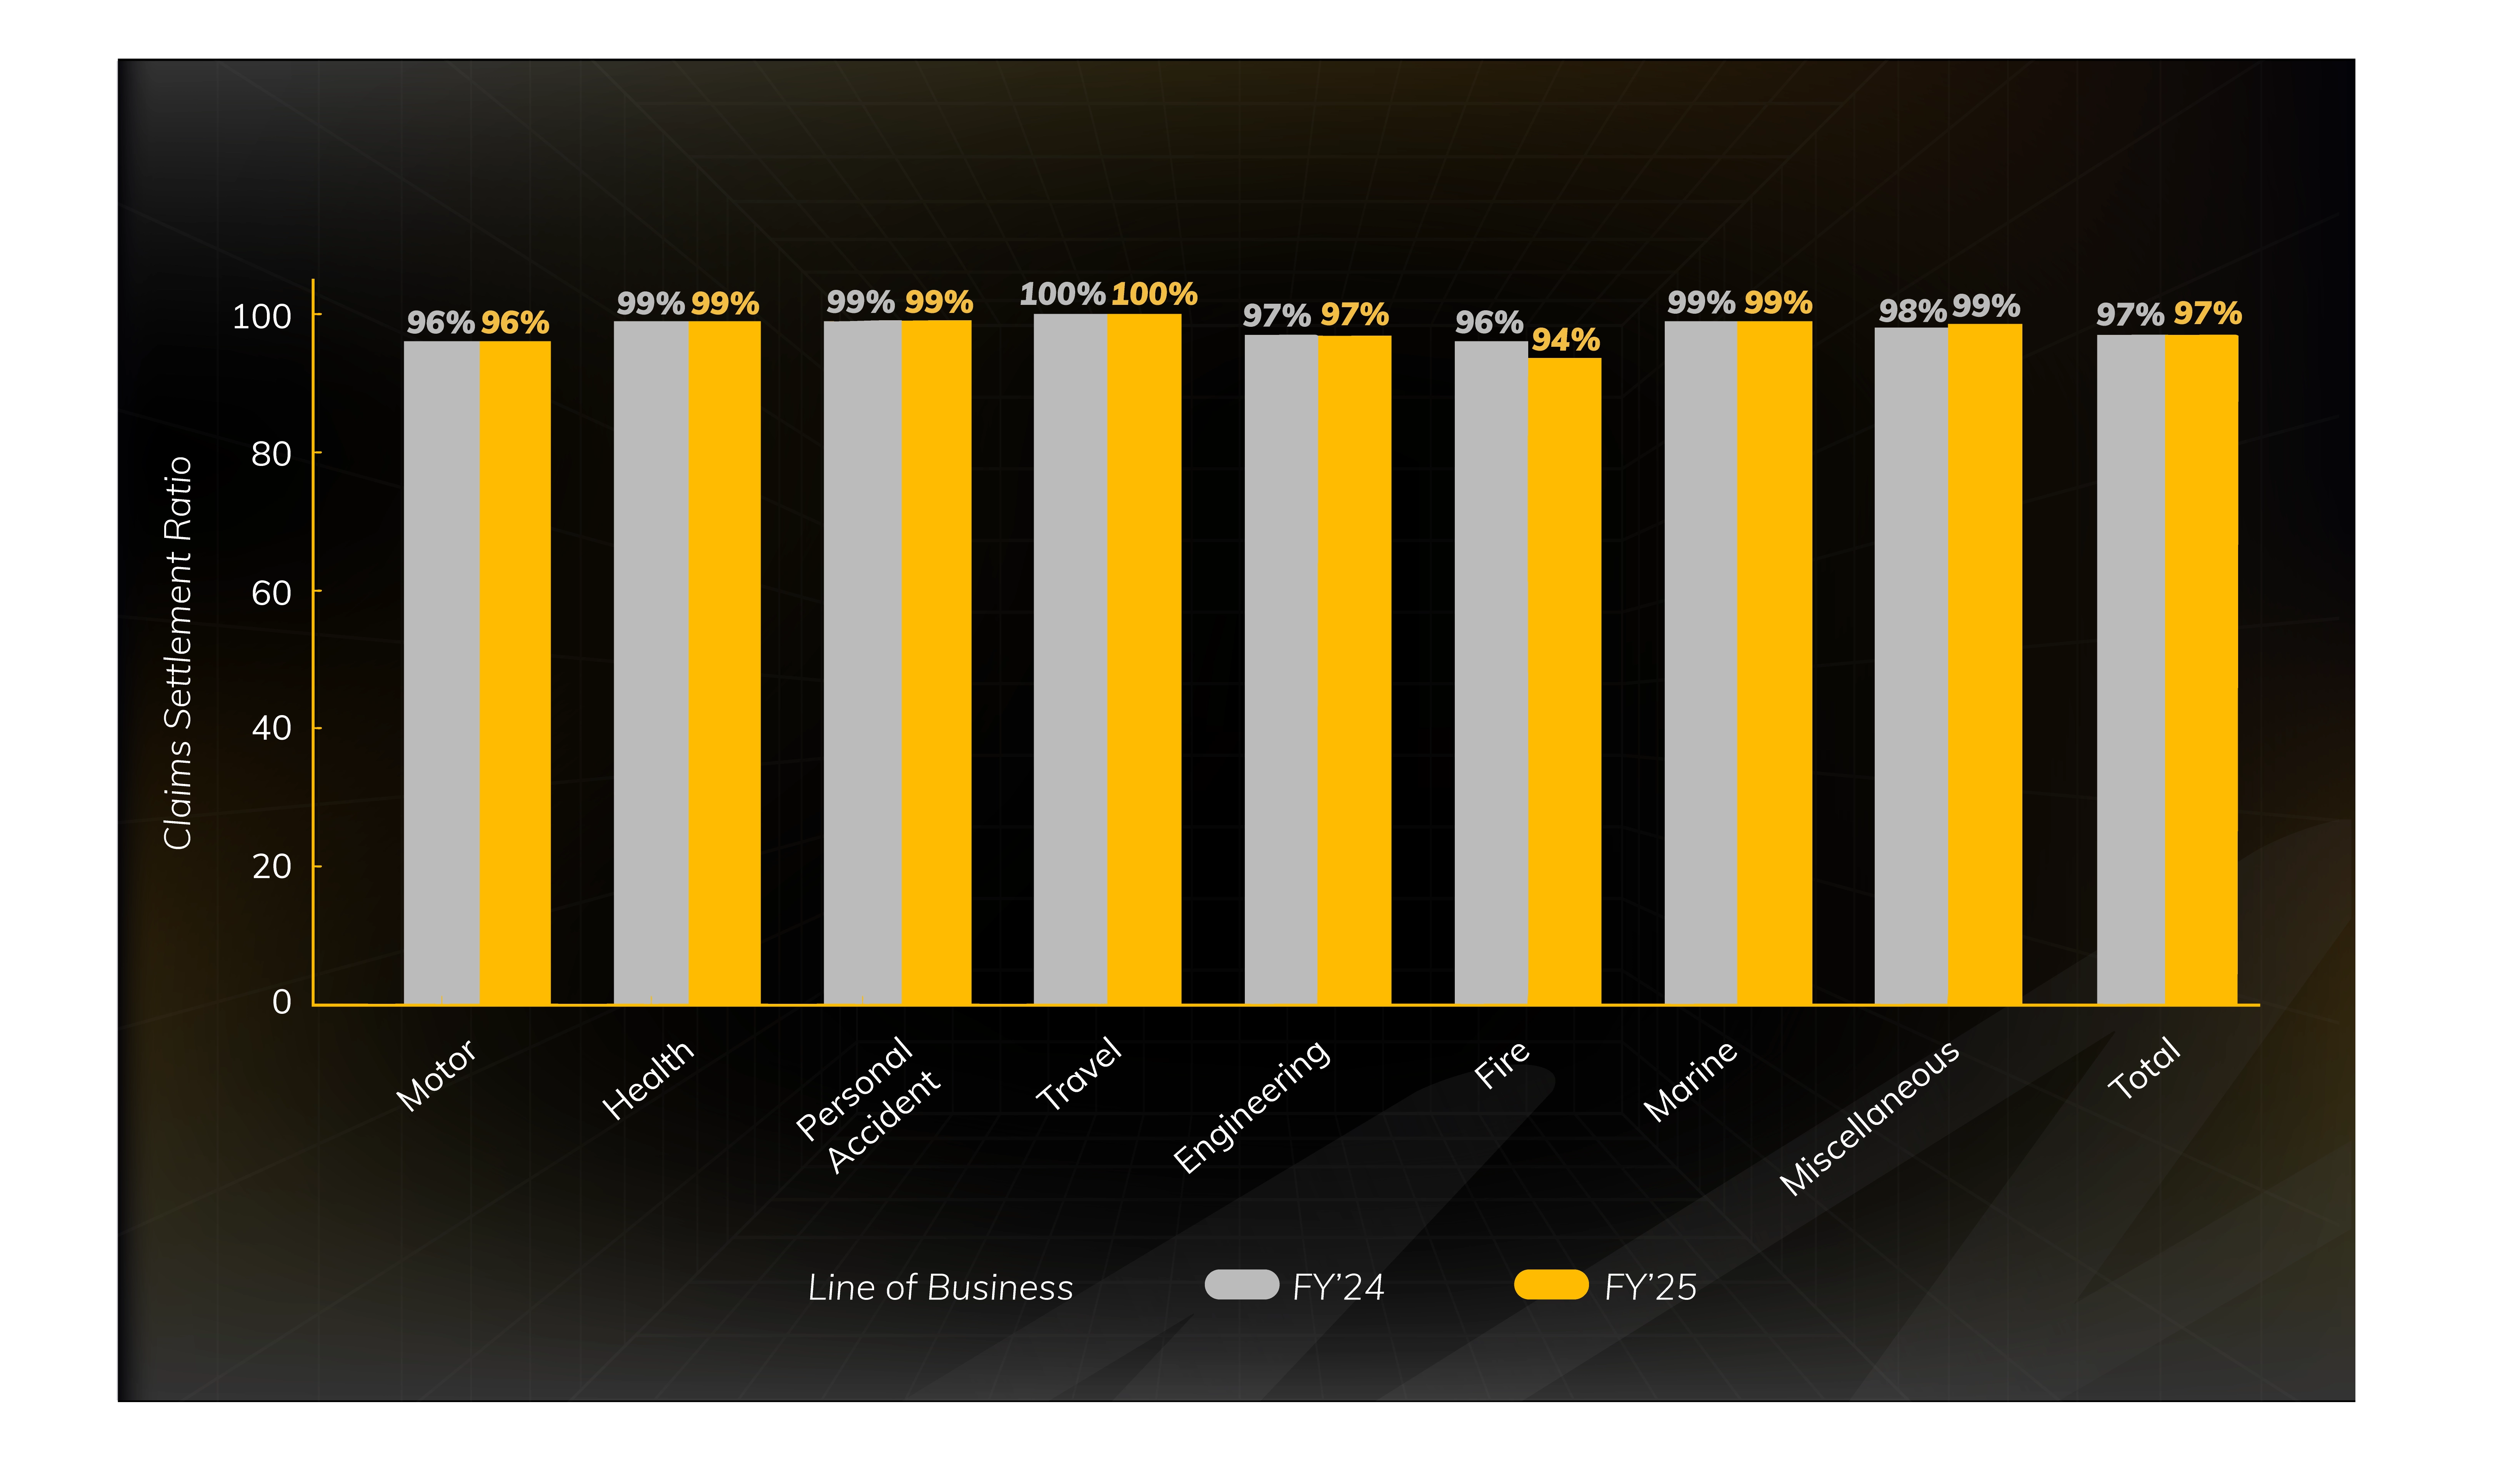
Notes: 1. Claims Settlement Ratio = (Claims Paid + Claims Closed)/(Claims outstanding at beginning of the year + Claims Reported - Claims outstanding at the end of the year). 2. Reinsurance and coinsurance inward claims not included
^^You can check CSR here: Public Disclosures - NL 37: Claims Data
The Real Picture: A Claims Settlement Ratio (CSR) indicates the efficiency with which the insurance company has dealt with the claims. A higher CSR denotes that the claims are decisioned swiftly. CSR alone should not be considered for considering the performance of an insurer. Additionally, one can also look at parameters like grievance ratio, net promoter score, customer satisfaction index, etc., to get a complete understanding of an insurer’s claims settlement
BREAKING DOWN OUR HEALTH INSURANCE CLAIMS PAYOUT
We heard you! In the last 6 months, the insurance industry saw a lot of buzz around need for better transparency related to health claims. So, here we are, breaking it down and making it more granular—separately for retail health and group policies (with key terms de-jargonised below).
| Status | Claims Count | ||
|---|---|---|---|
| Retail Health | Group Health | Total | |
| A. Outstanding on 1st April 2024 | 315 | 4,711 | 5,026 |
| B. Claims Intimated | 8,017 | 2,06,071 | 2,14,088 |
| C. Claims Paid | 6,764 | 1,92,603 | 1,99,367 |
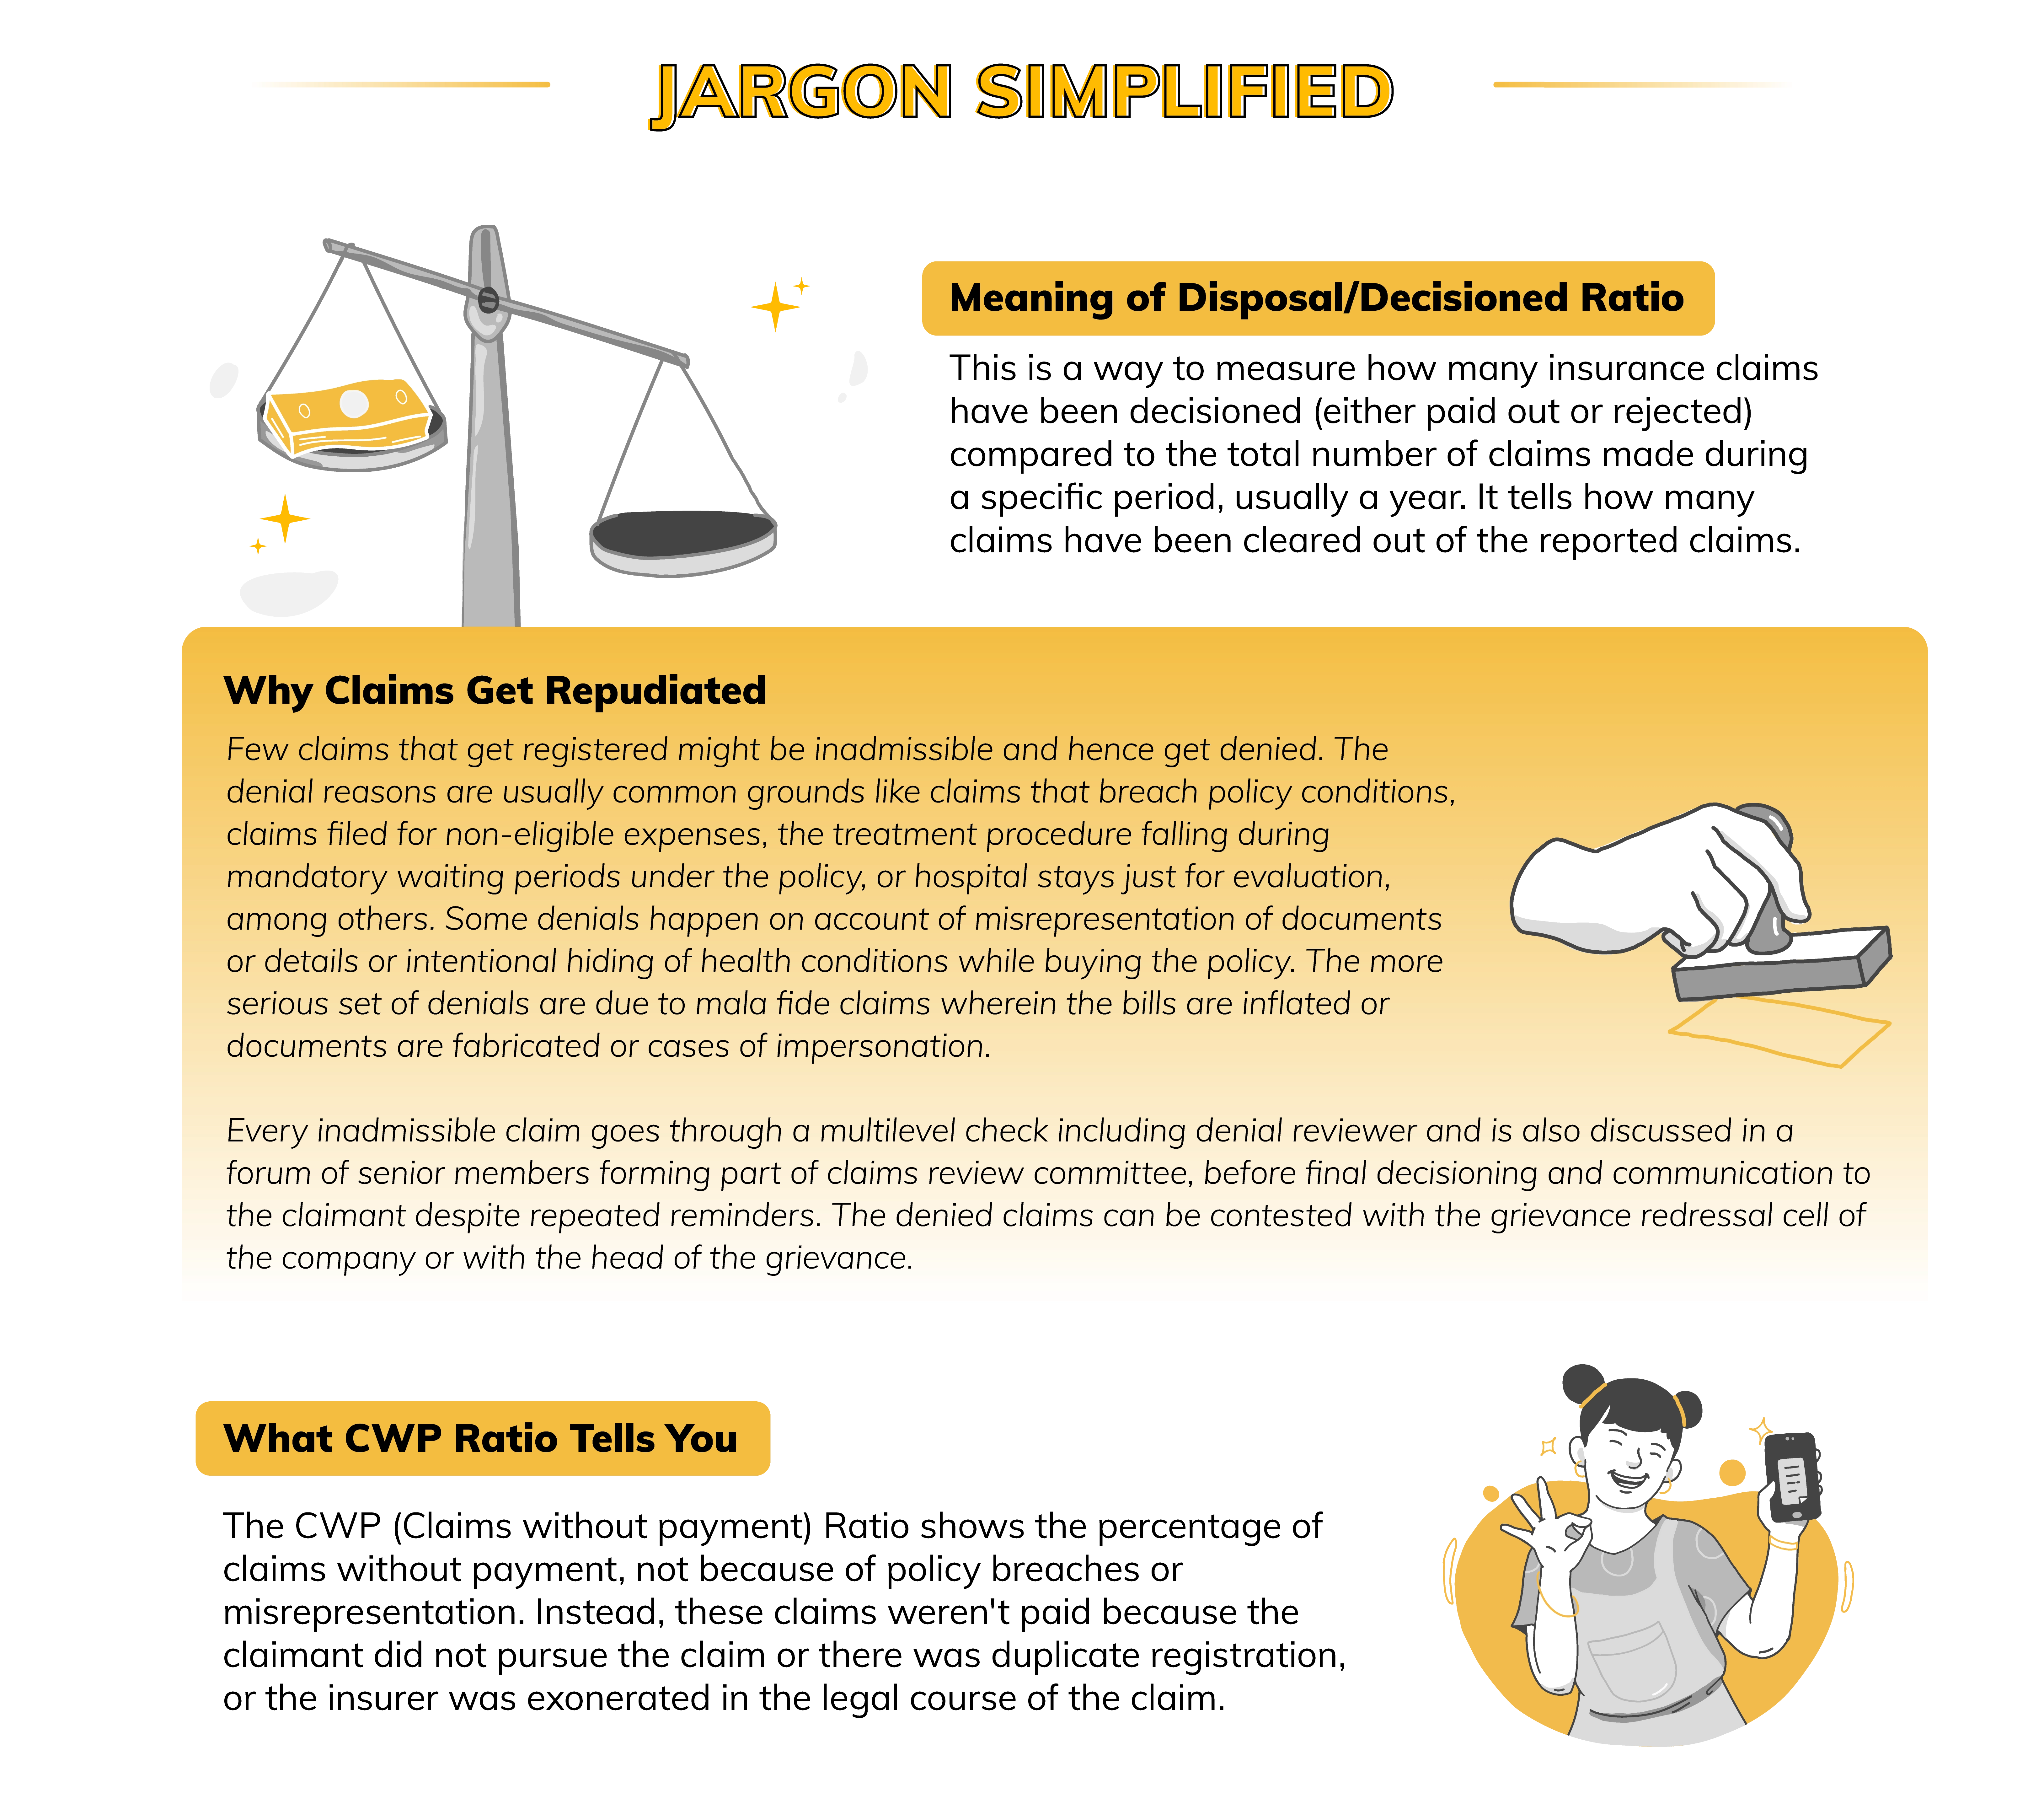
| D. Claims Repudiated | 655 | 1,555 | 2,210 |
| E. Claims CWP | 543 | 10,977 | 11,520 |
| F. Outstanding at the end | 370 | 5,647 | 6,017 |
| Status | Retail Health | Group Health | Total |
| Decided % (C+D+E/A+B) | 96% | 97% | 97% |
| Pending % (F/A+B) | 4% | 3% | 3% |
| WHAT ELSE TO LOOK AT: | |||
| Repudiation % (D/A+B-F) | 8% | 1% | 1% |
| CWP % (E/A+B-F) | 6% | 5% | 5% |
*Data excludes PA, Travel; data as on 31 March 2025.
The Real Picture: The faster the better. Faster decisioning of claim helps in faster settlement. 97% of the total claims received have been decisioned in a seamless manner—one of the aspects of us having high customer satisfaction. The 3% pending claims are claims that are yet to be decisioned where we either await documents/information from the customers/hospitals or they are under process from our end.
Now every customer is anxious to know whether claim gets paid or rejected. While we have 1% claims getting repudiated, retail health has a higher ratio of 8%, which is predominantly on account of waiting periods applicable under the retail policy, whereas group health typically has no waiting periods.
INSIDER VIEW: PROCESSING CLAIMS IN A JIFFY! ⚡
At Digit, our Turnaround Times (TATs)—the speed at which we settle your claims—are not just metrics; they are a testament to our dedication to being there for you when you need us most. Let's delve into the specifics of how quickly we delivered on our promise across our various lines of business:
HEALTH INSURANCE HOSPITALIZATION CLAIMS
When you buy a health insurance policy and make a claim, there are majorly three things that should go super smoothly—how quickly the cashless facility gets approved, the time it takes to get discharged from the hospital and the time it takes to get the reimbursement in case you did not utilise the cashless facility.
CASHLESS FACILITY APPROVAL
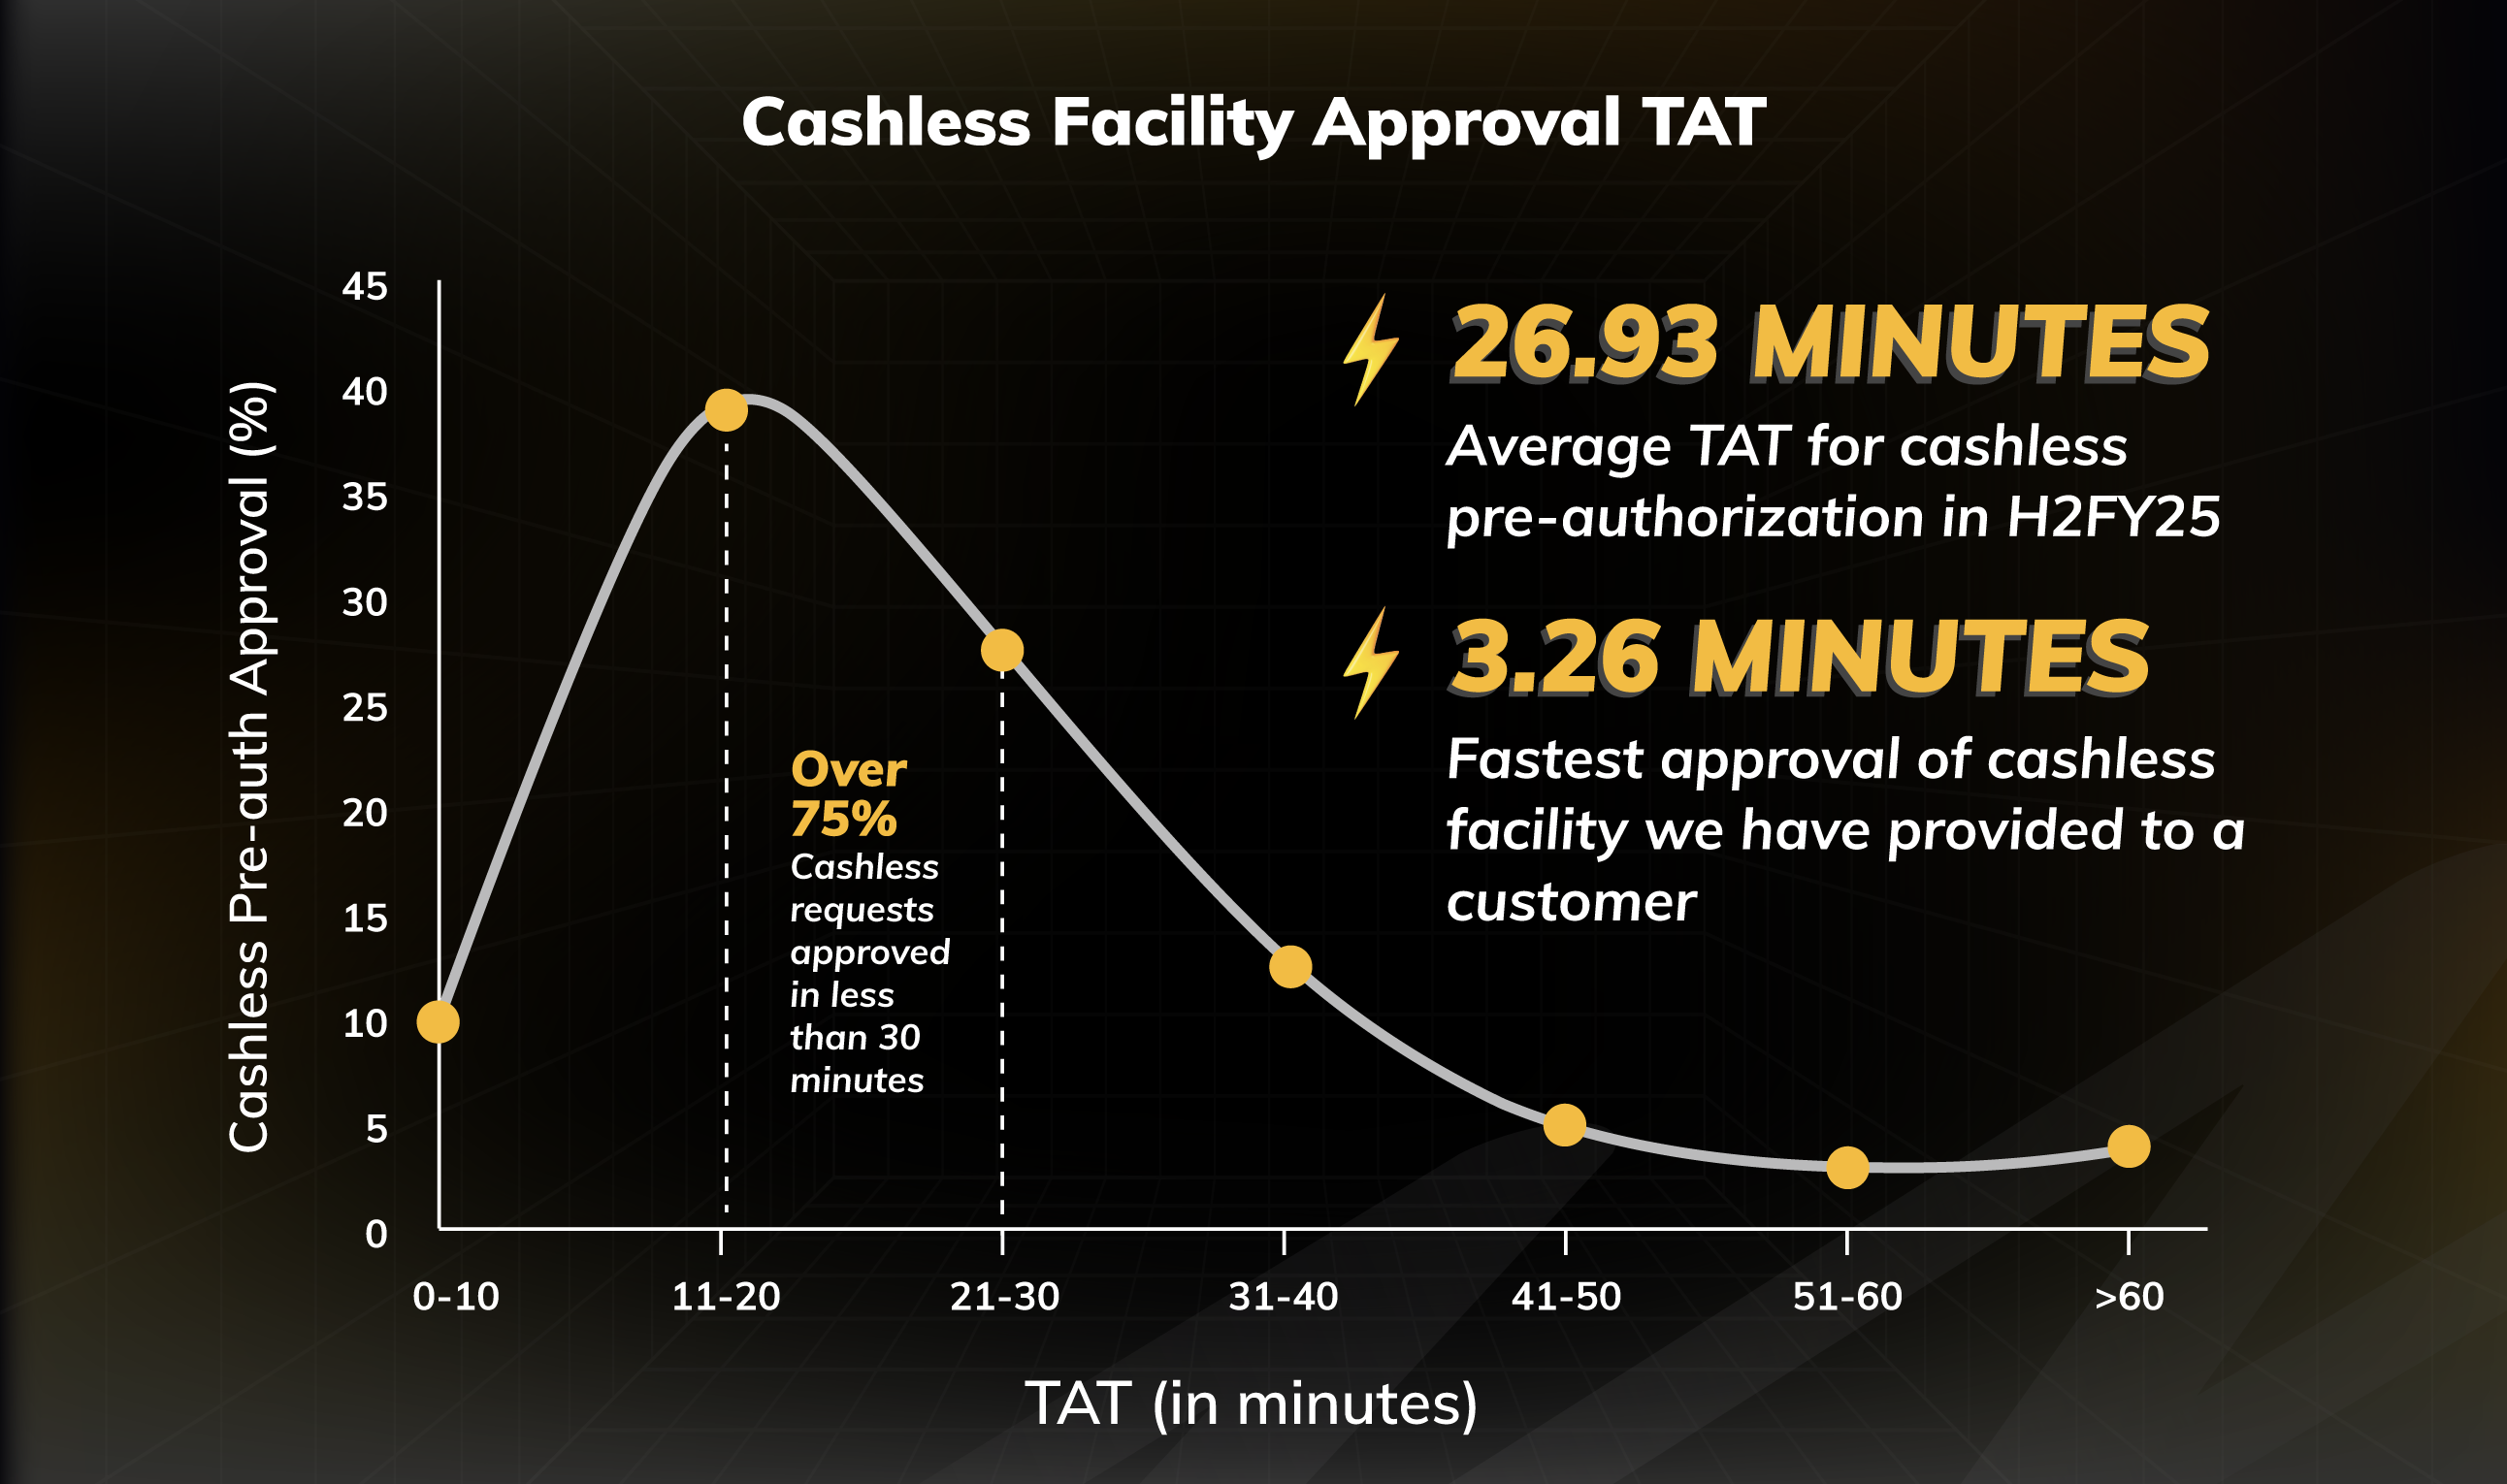
The Real Picture: In H2FY25, our average TAT for cashless pre-authorization was 26.93 minutes. In fact, over 75% of the cashless requests were approved in less than 30 minutes. However, 3.30% of the requests took a little over 60 minutes to process as these cases either required additional clarifications from the hospital/customer or were under verification.
CASHLESS DISCHARGE APPROVAL
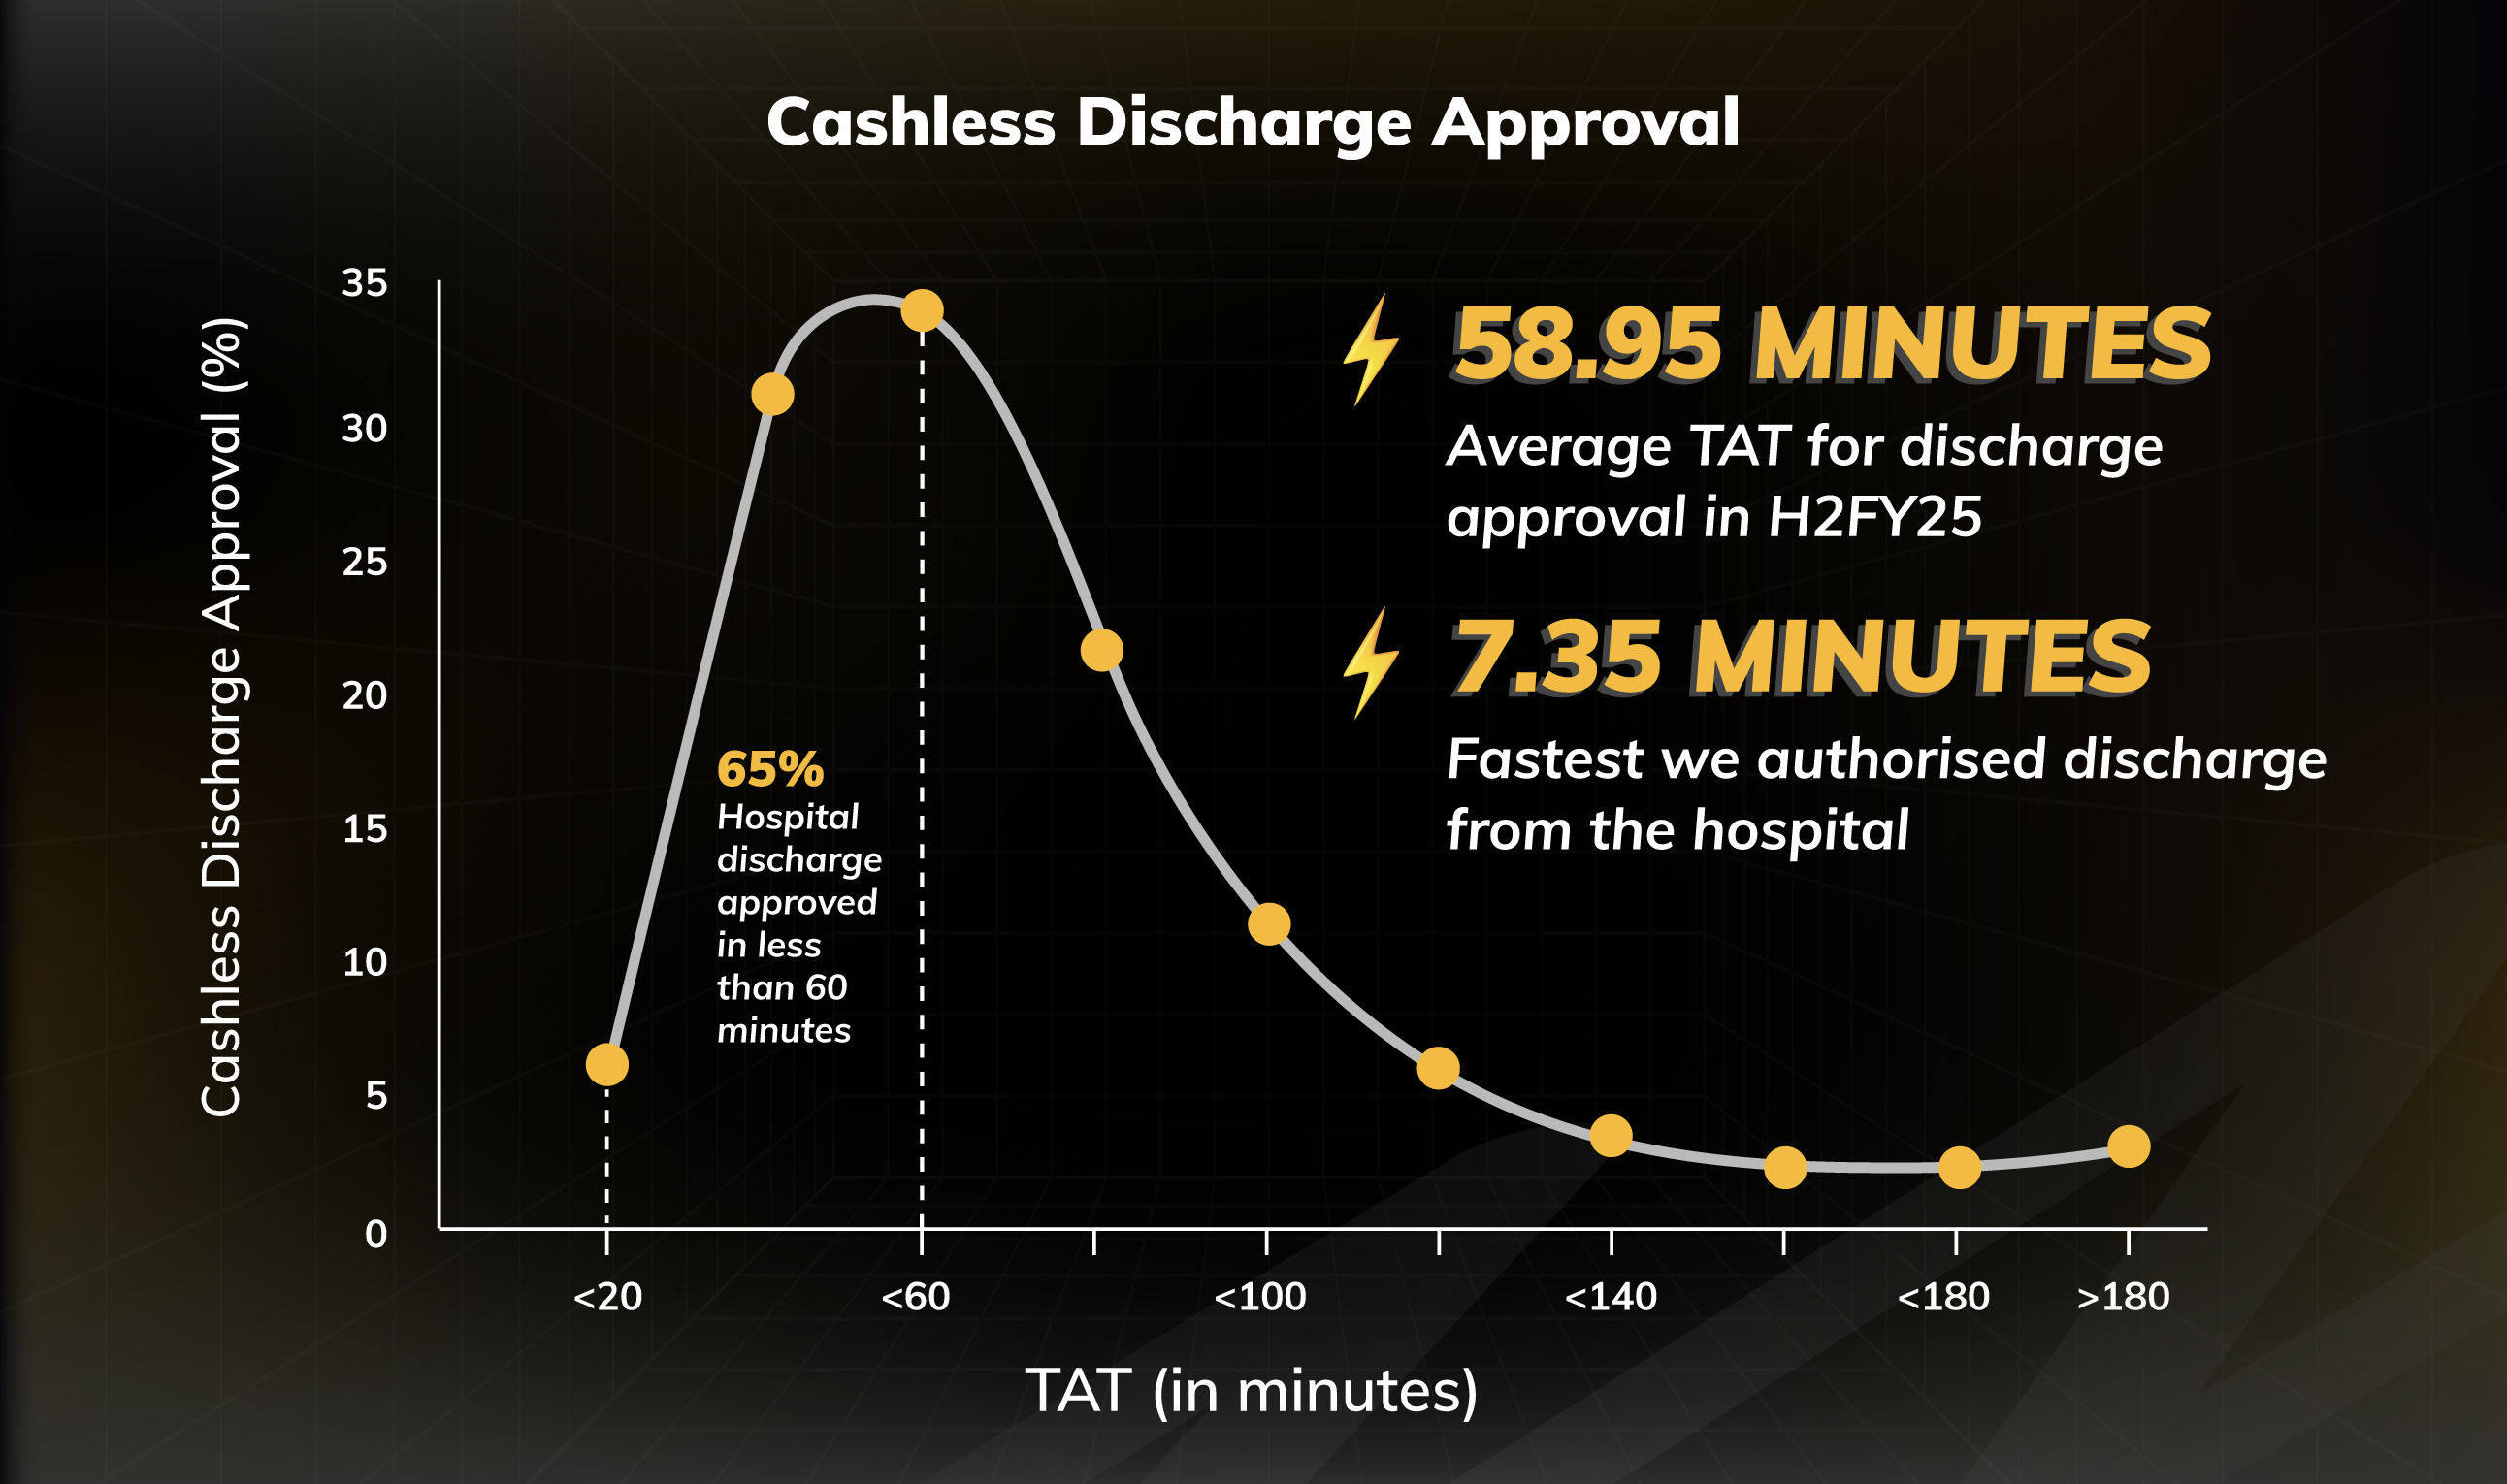
The Real Picture: In H2FY25, our average TAT for discharge approval stood at 58.95 minutes. In fact, 65% of discharge approvals were done in less than 60 minutes. However, 1.3% of the requests took a little over 3 hours. This may happen as in some complex cases additional clarifications are required from the hospital/customer.
REIMBURSEMENT CLAIMS SETTLEMENT
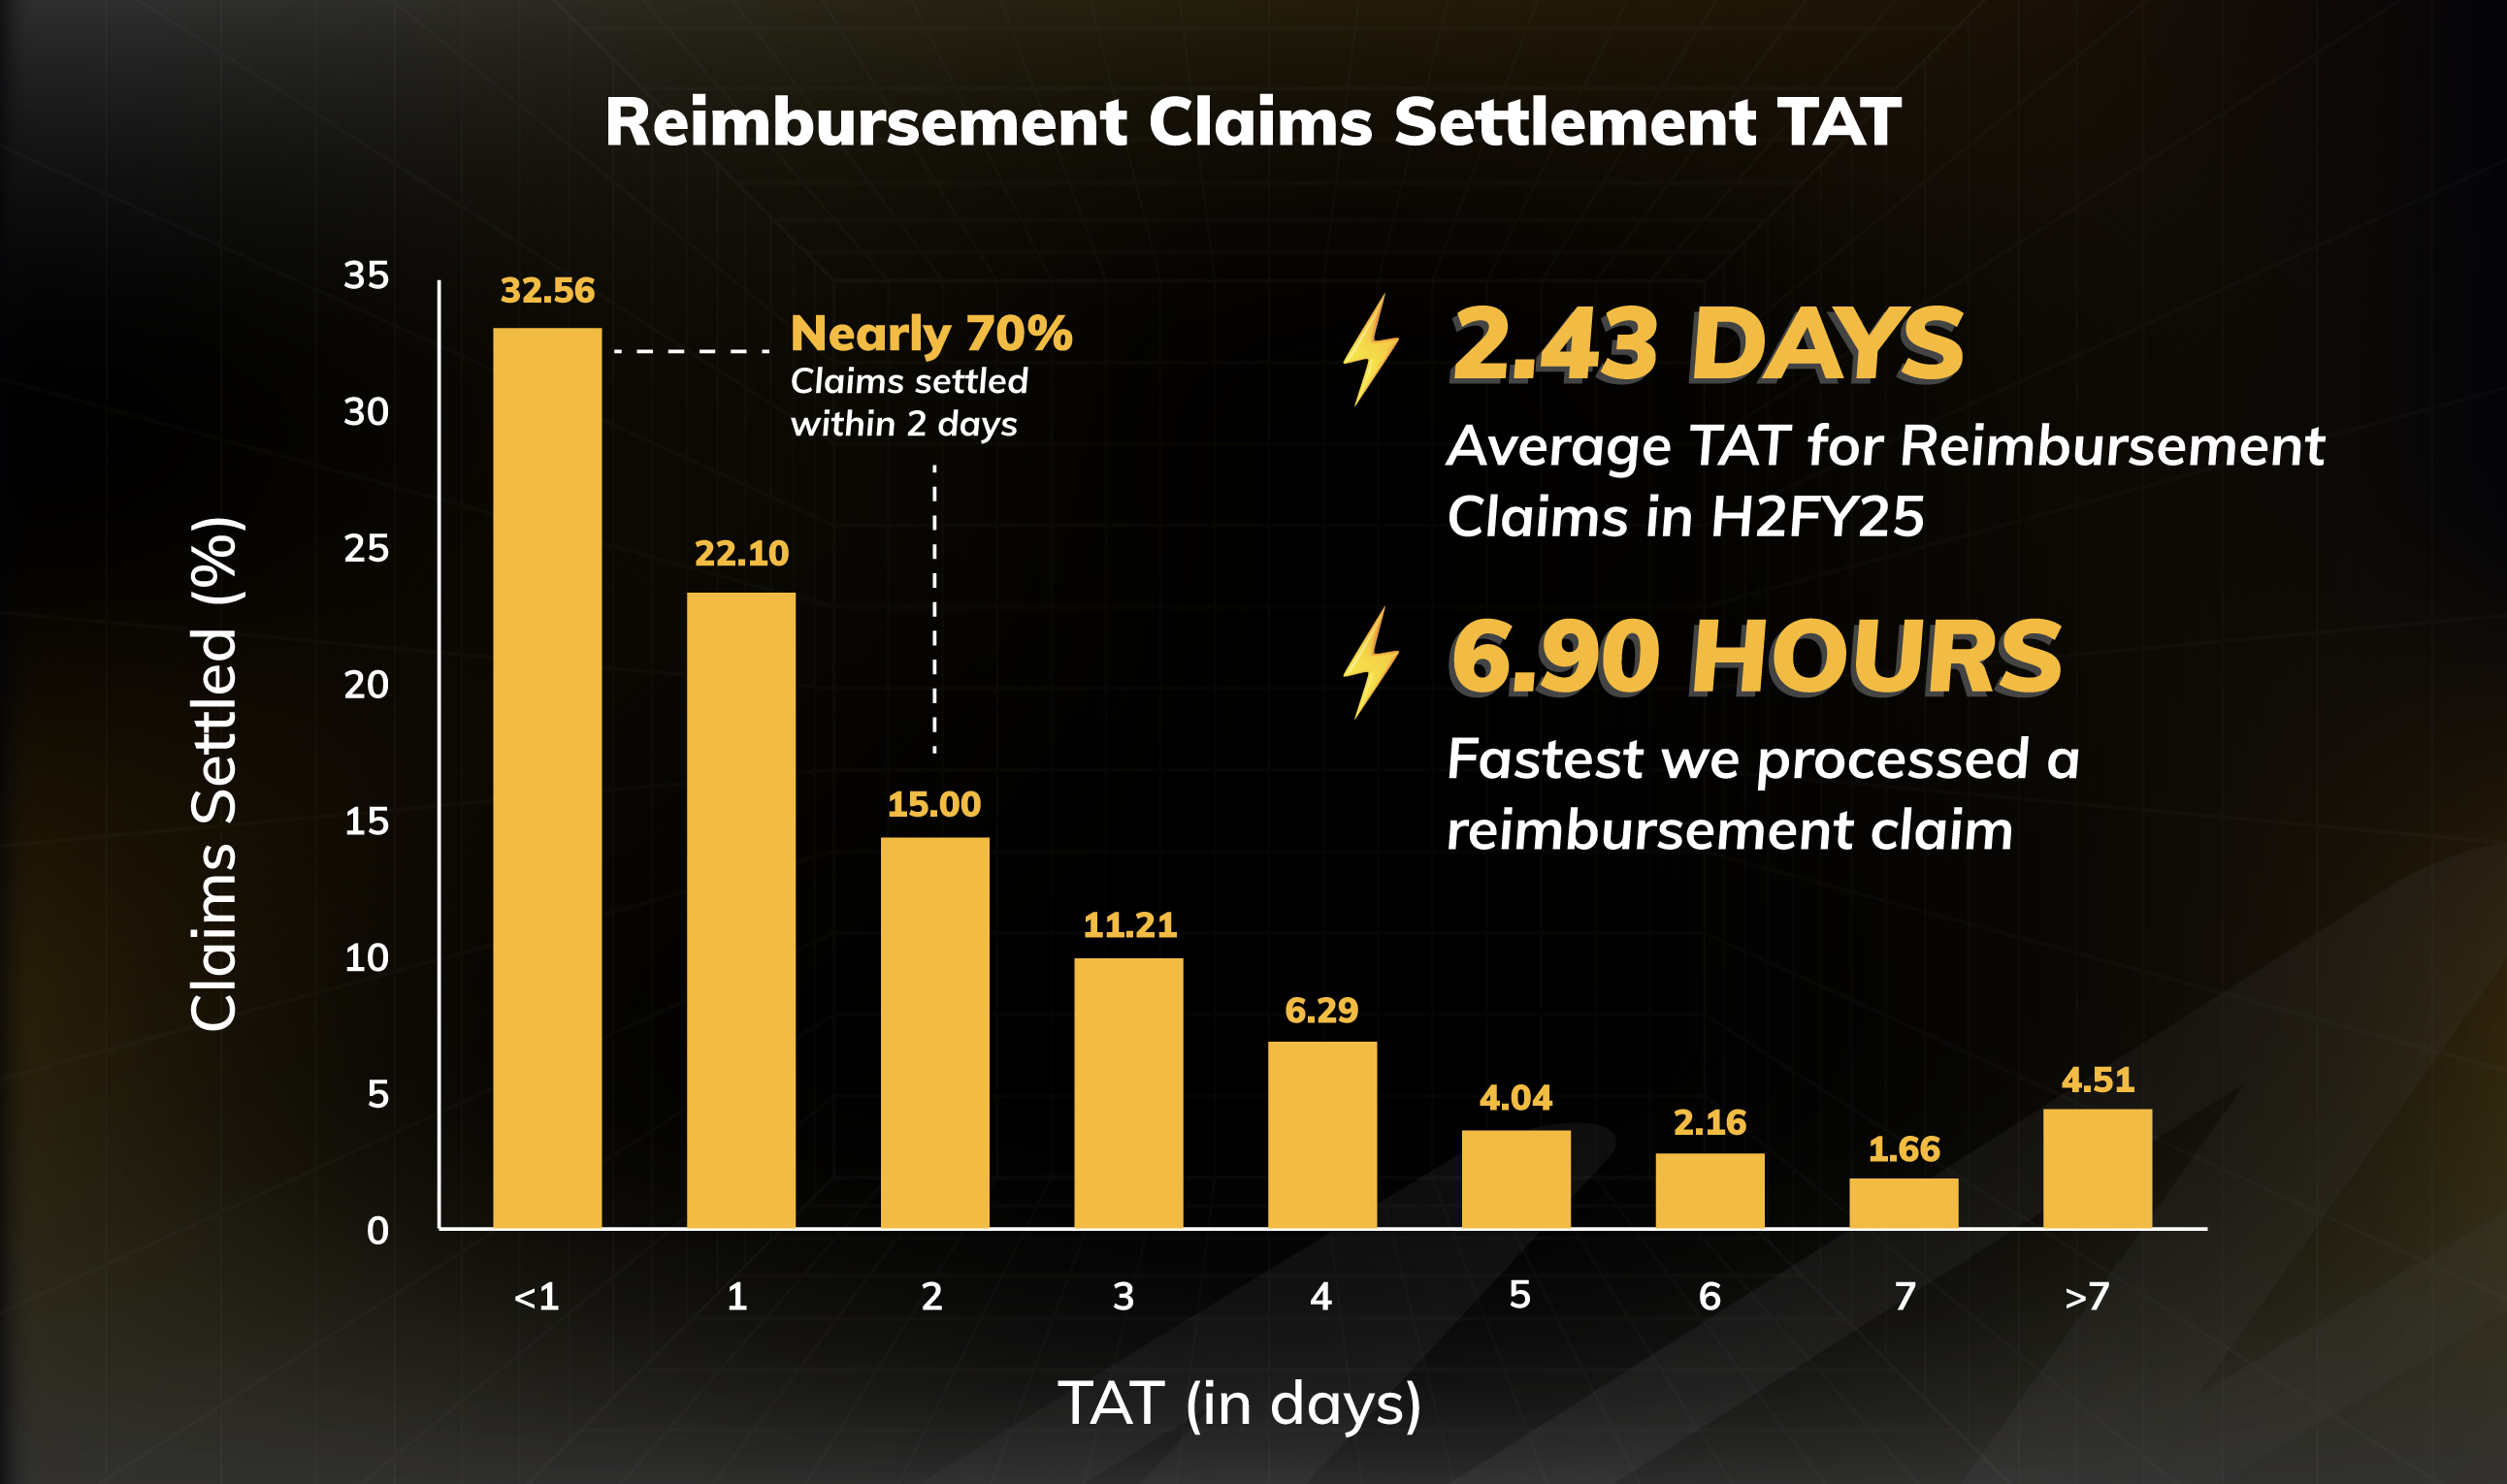
The Real Picture: In H2FY25, our average TAT for reimbursement claims (after all documents were received) stood at 2.43 days. In fact, nearly 70% of all the claims were settled within 2 days. However, for around 4.5% of cases, the claims settlement took a little over 7 days.
HOW QUICKLY WE APPROVE VEHICLE REPAIR
Once a motor insurance claim is registered, the vehicle is assessed at a network garage, and repair work begins only after insurer approval. Quick claim assessment and repair order issuance are essential for timely repairs. We track this time to ensure your vehicle repair begins as soon as possible.
MOTOR INSURANCE VEHICLE REPAIR APPROVAL
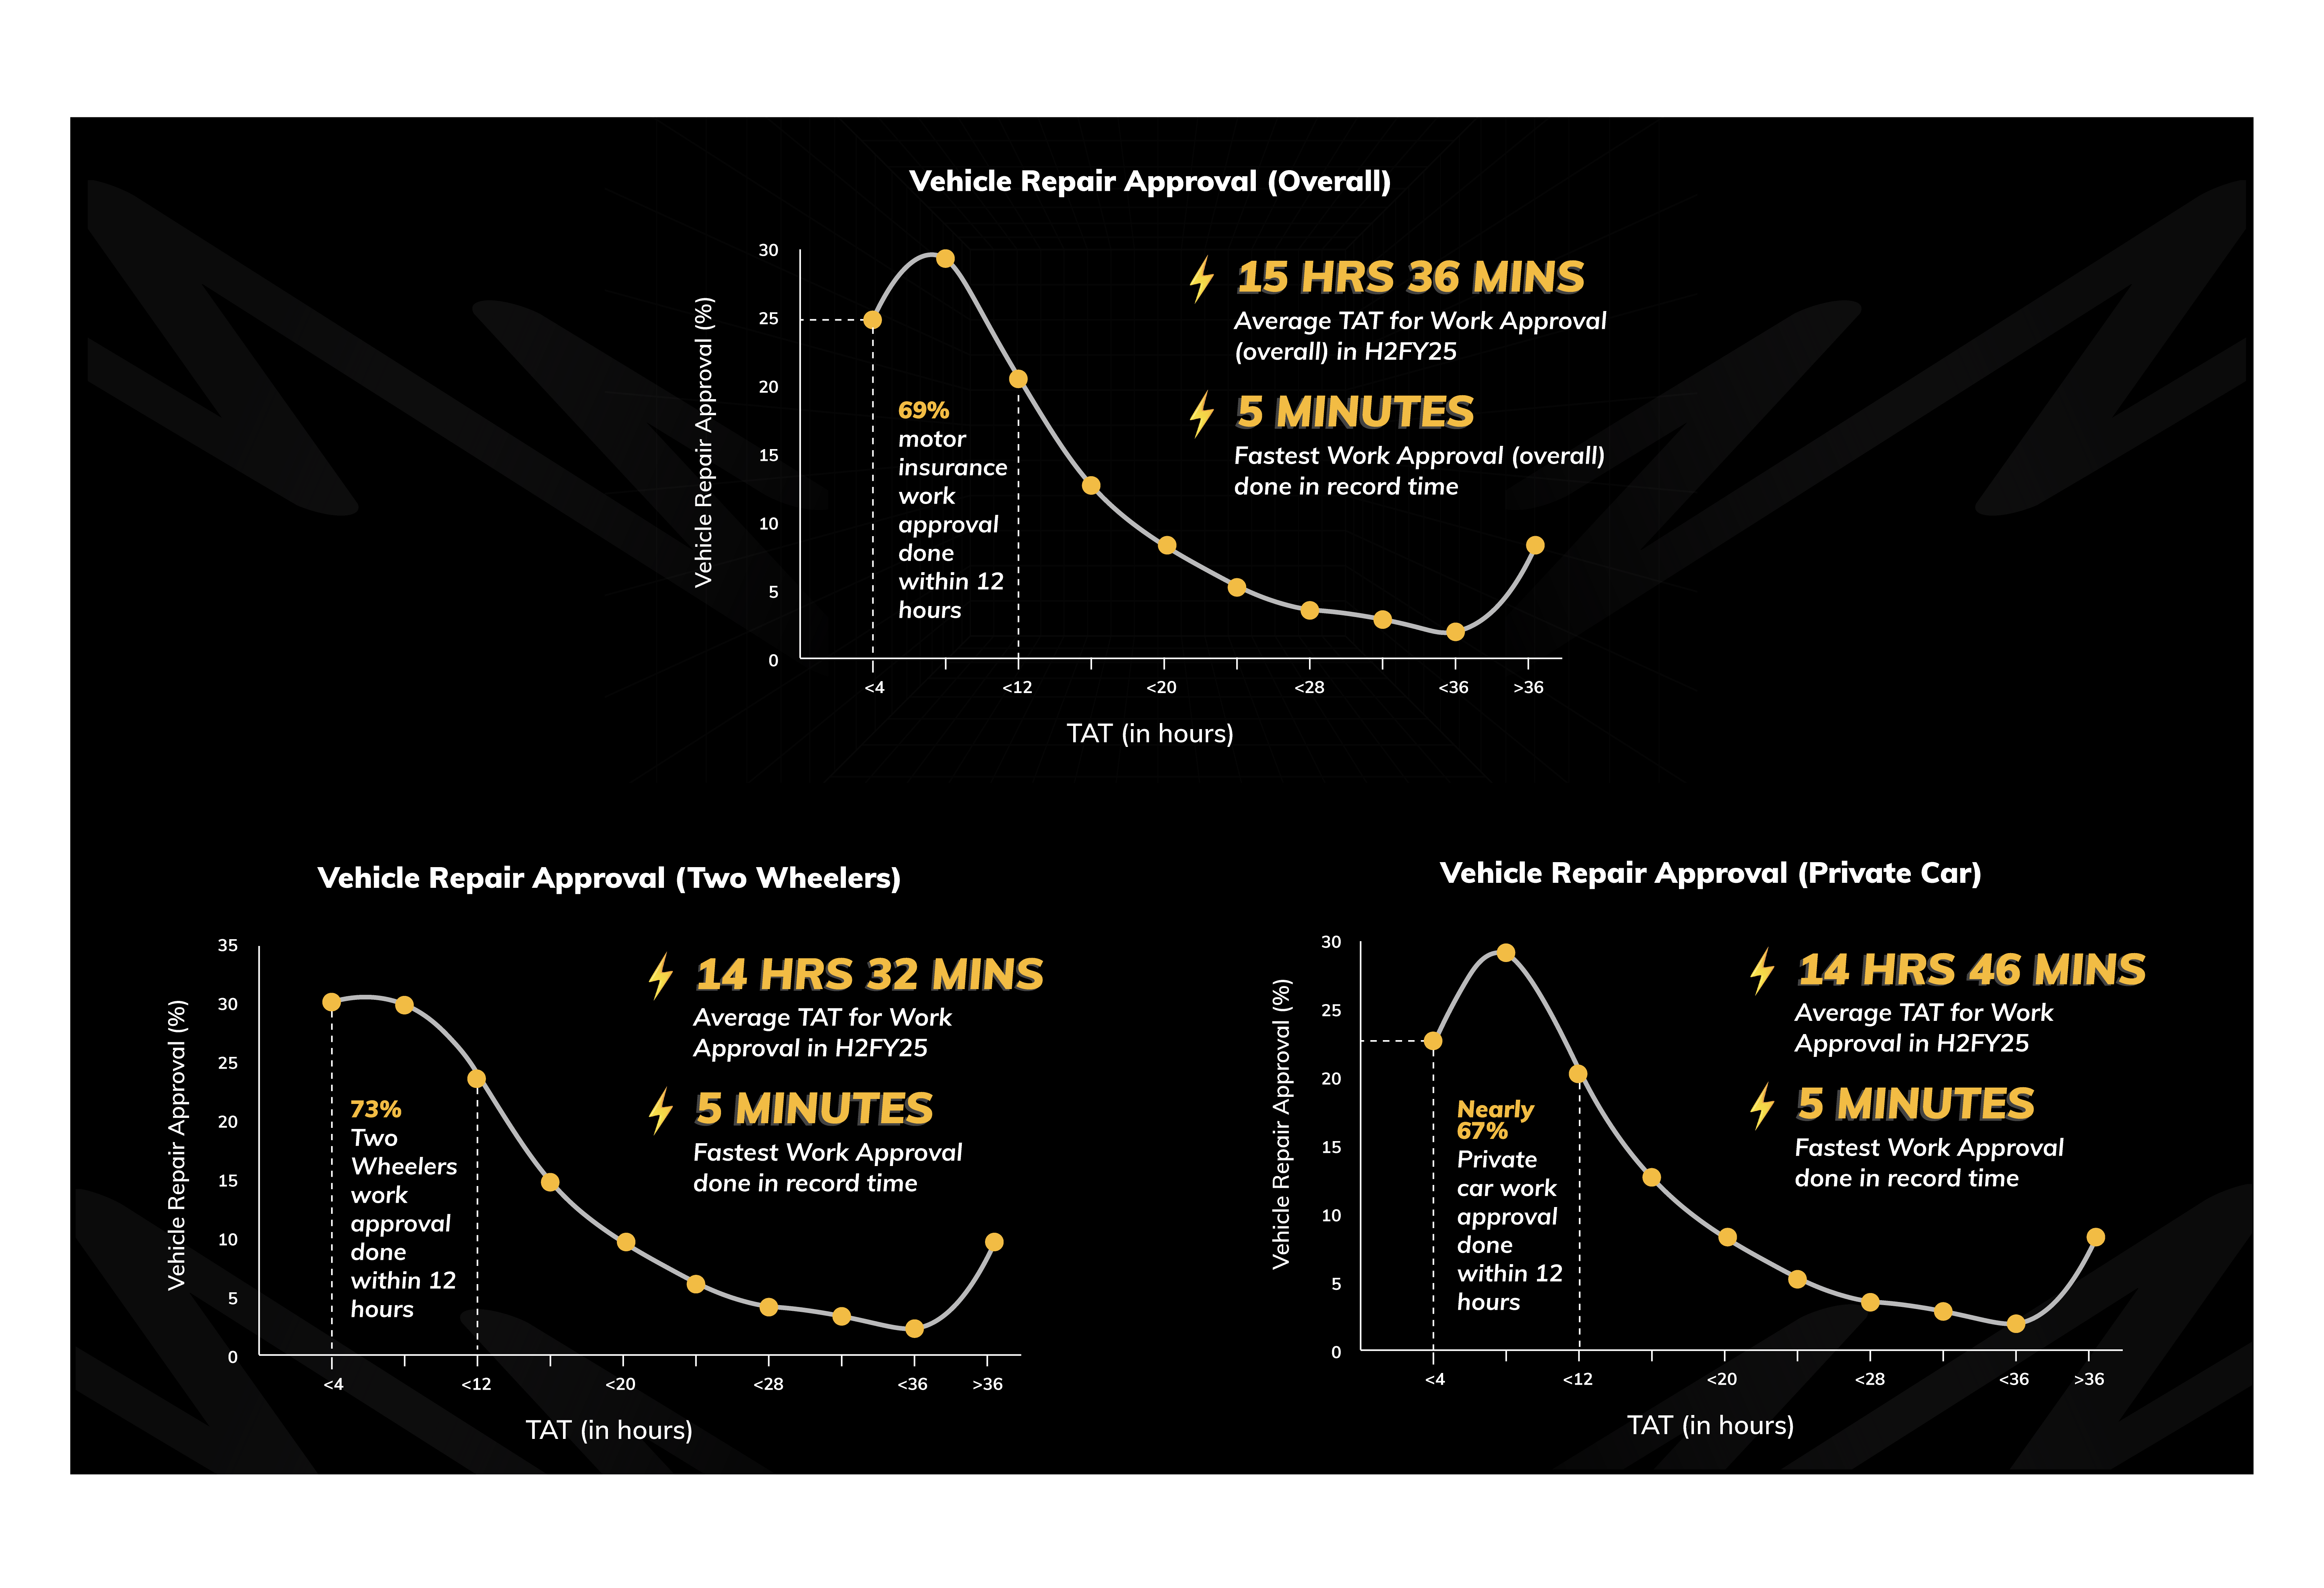
The Real Picture: In H2FY25, average TAT for overall repair approval stood at 15 hours and 36 minutes. In fact, 69% of the repair approval was completed within 12 hours. However, in about 7.47% of cases, it took us a little over 36 hours to approve the requests.
What to know: Customers also play a crucial role in reducing TAT. When filing a claim, leveraging technology can significantly speed things up. Customers can either call the service center and receive a self-service link to upload damage photos, or they can file a claim through the Digit app. Our apps empower workshops to ensure that work moves forward without unnecessary delays.
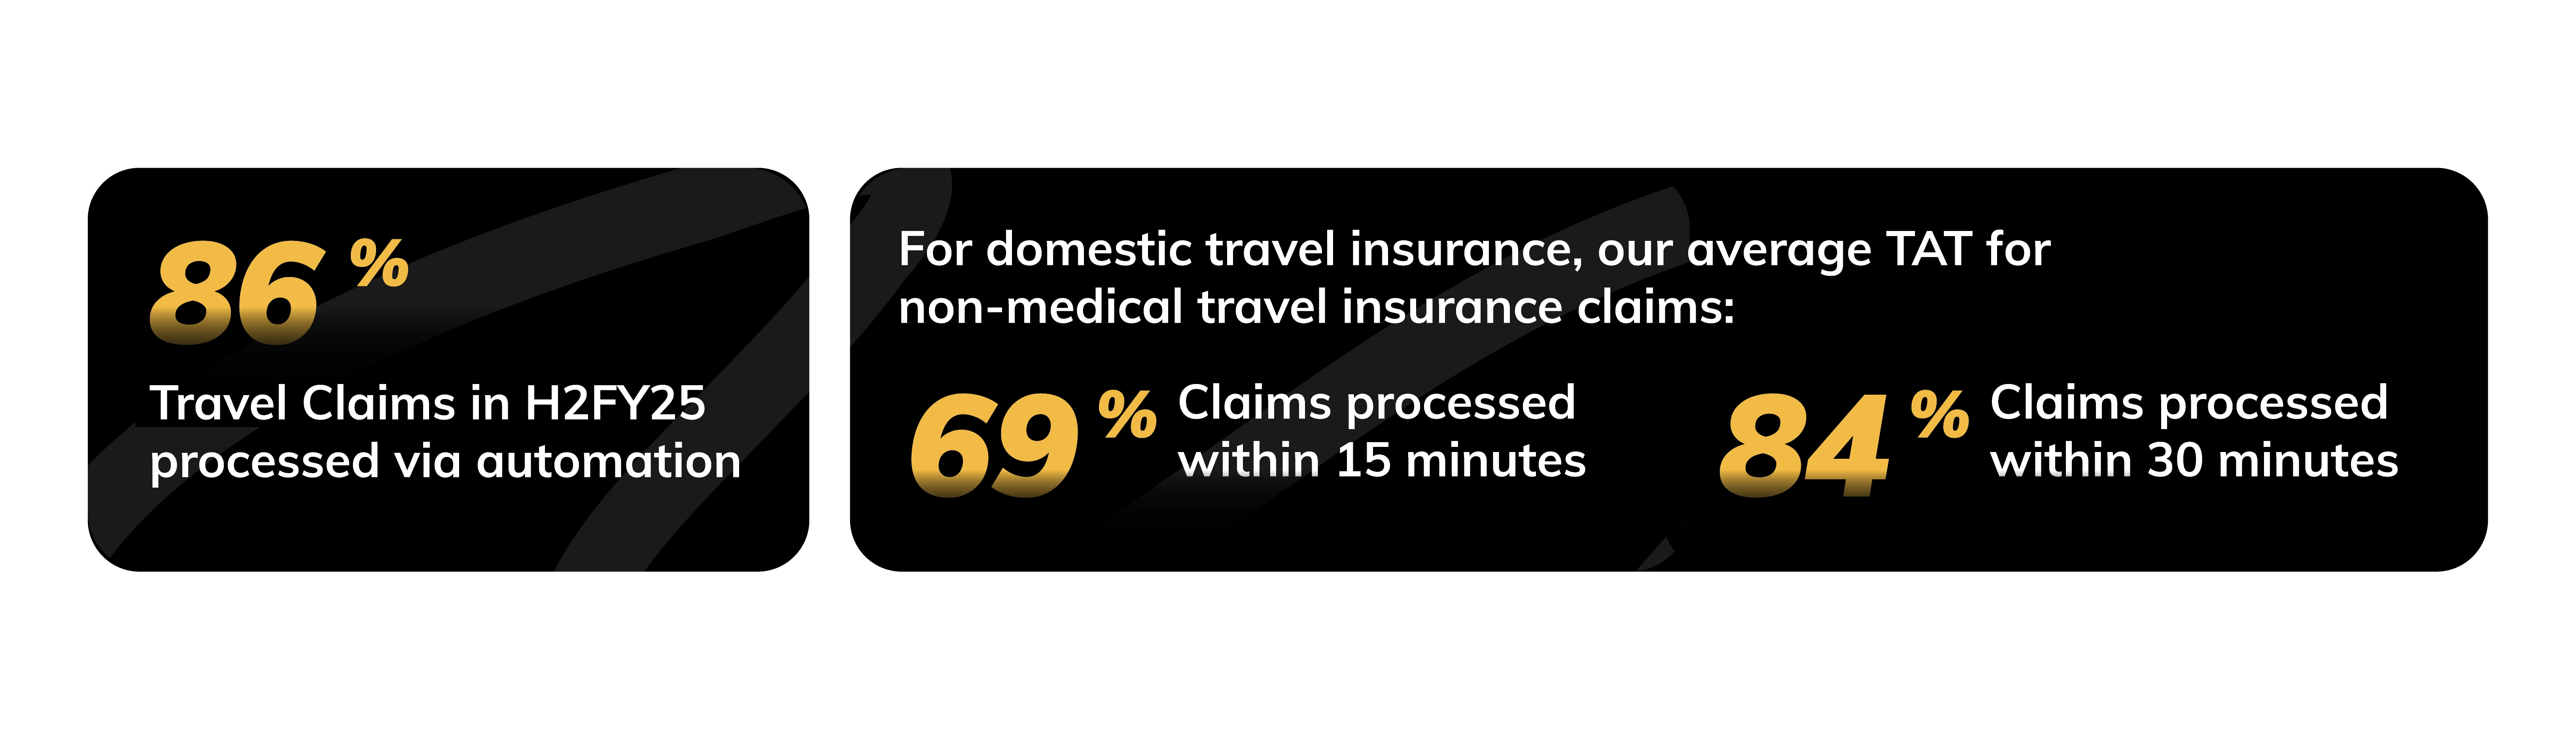
TRAVEL INSURANCE CLAIMS
Travel insurance claims (barring medical claims) are typically low-ticket size claims. We use automation and ask for minimal documentation to process these claims quickly.
OPEN BOOK: DO INSURERS REJECT A LOT OF CLAIMS? 🤔
Let's be honest, you've probably heard the stories—those frustrating tales of drawn-out claim processes, the feeling of having to fight tooth and nail on social media, the delays, or even outright rejections. We understand the frustration and that’s why we wanted to remove any sort of ambiguity and transparently show our claims escalations.
As per the regulatory framework, if you are unsatisfied with the decision of an insurer, you have the option of approaching the Insurance Ombudsman^. Let’s contextualise this for you. We try our best to get every claim right. But there can be mistakes. That’s why we track how many complaints got escalated to the Ombudsman, how many got decided and how many we lost.
| Ombudsman Complaints for FY 2024-25# | ||||||
|---|---|---|---|---|---|---|
| LOB | Total Claims Paid (in number) | Total Claims Amounts Settled | Total complaints that went to Ombudsman | Total complaints where final decision was given | Total complaints settled via mediation | Total decisions in favour of Customer |
| Health (Including PA, travel) | 2,18,082 | ₹ 1374.64 Crore | 110 | 86 | 21 | 18 |
| Motor (OD + TP, Including theft, PA) | 6,51,954 | ₹ 2,199.58 Crore | 124 | 104 | 28 | 26 |
| Other LOBs (miscellaneous) | 45,642 | ₹ 1,047.34 Crore | 22 | 17 | 3 | 3 |
| Grand Total | 9,15,678 | ₹ 4,621.56 Crore | 256 | 207 | 52 | 47 |
The Real Picture: Out of 256 complaints that went to Hon’ble Ombudsman^, 207 cases were closed during the year (49 are still pending or outstanding). Of the 207 cases, 52 were settled through mediation (between insured and the insurer). Of the remaining 155 cases, 47 decisions went in favour of the customer.
During FY 2024-25, we settled nearly 9.16 lakh insurance claims worth ₹4,622 crore. To put it simply, as per the data of instances escalated to Hon’ble Ombudsman owing to claims, we had a claims accuracy of 99.9950% i.e. out of 9.16 lakh times, 46 customers felt we were wrong, escalated it, and were proved to be right#. We don’t defend this number—we learn from it. Our aim will also be to settle 100% of all the genuine claims.
Notes:
^This data pertains to cases reported to various offices of Hon’ble Insurance Ombudsman. Customers have the option to approach Consumer forum as well; #Only includes complaints arising from claims. Company had a total of 11 complaints arising from non-claim i.e. policy related grievances (5 won, 2 settled, 1 lost and 3 outstanding). One non-claim complaint where decision went in favour of complainant is not included in numerator while calculating claims accuracy.
WHY CLAIMS MAY GET REJECTED SOMETIMES
We have observed in many cases that the primary reason a claim is not approved relates to gap in understanding the policy coverage. Your policy document clearly outlines what's included and, just as importantly, what's excluded. Our “Digit Simplifies” section also de-jargonises complicated insurance terms. As an insurer, we are always available even if you need the smallest of clarifications.
TRUST THE PROCESS 😇
SETTLING GENUINE CLAIMS—BIG OR SMALL
We sometimes don’t realise, how big some of the claims can be. Let’s show you some of the biggest claims we settled in FY 2024-25.
The Real Picture: In Third Party private car, we saw a claim payout of ₹1.5 crore from Raipur, while TP two-wheeler saw a payout of ₹1.12 crore. Highest health insurance claim settlement was from Bangalore worth ₹16.77 lakh. A travel plan (that typically just costs ₹1,000-2,000) saw a claim of ₹11.51 lakh for a customer travelling to Thailand.
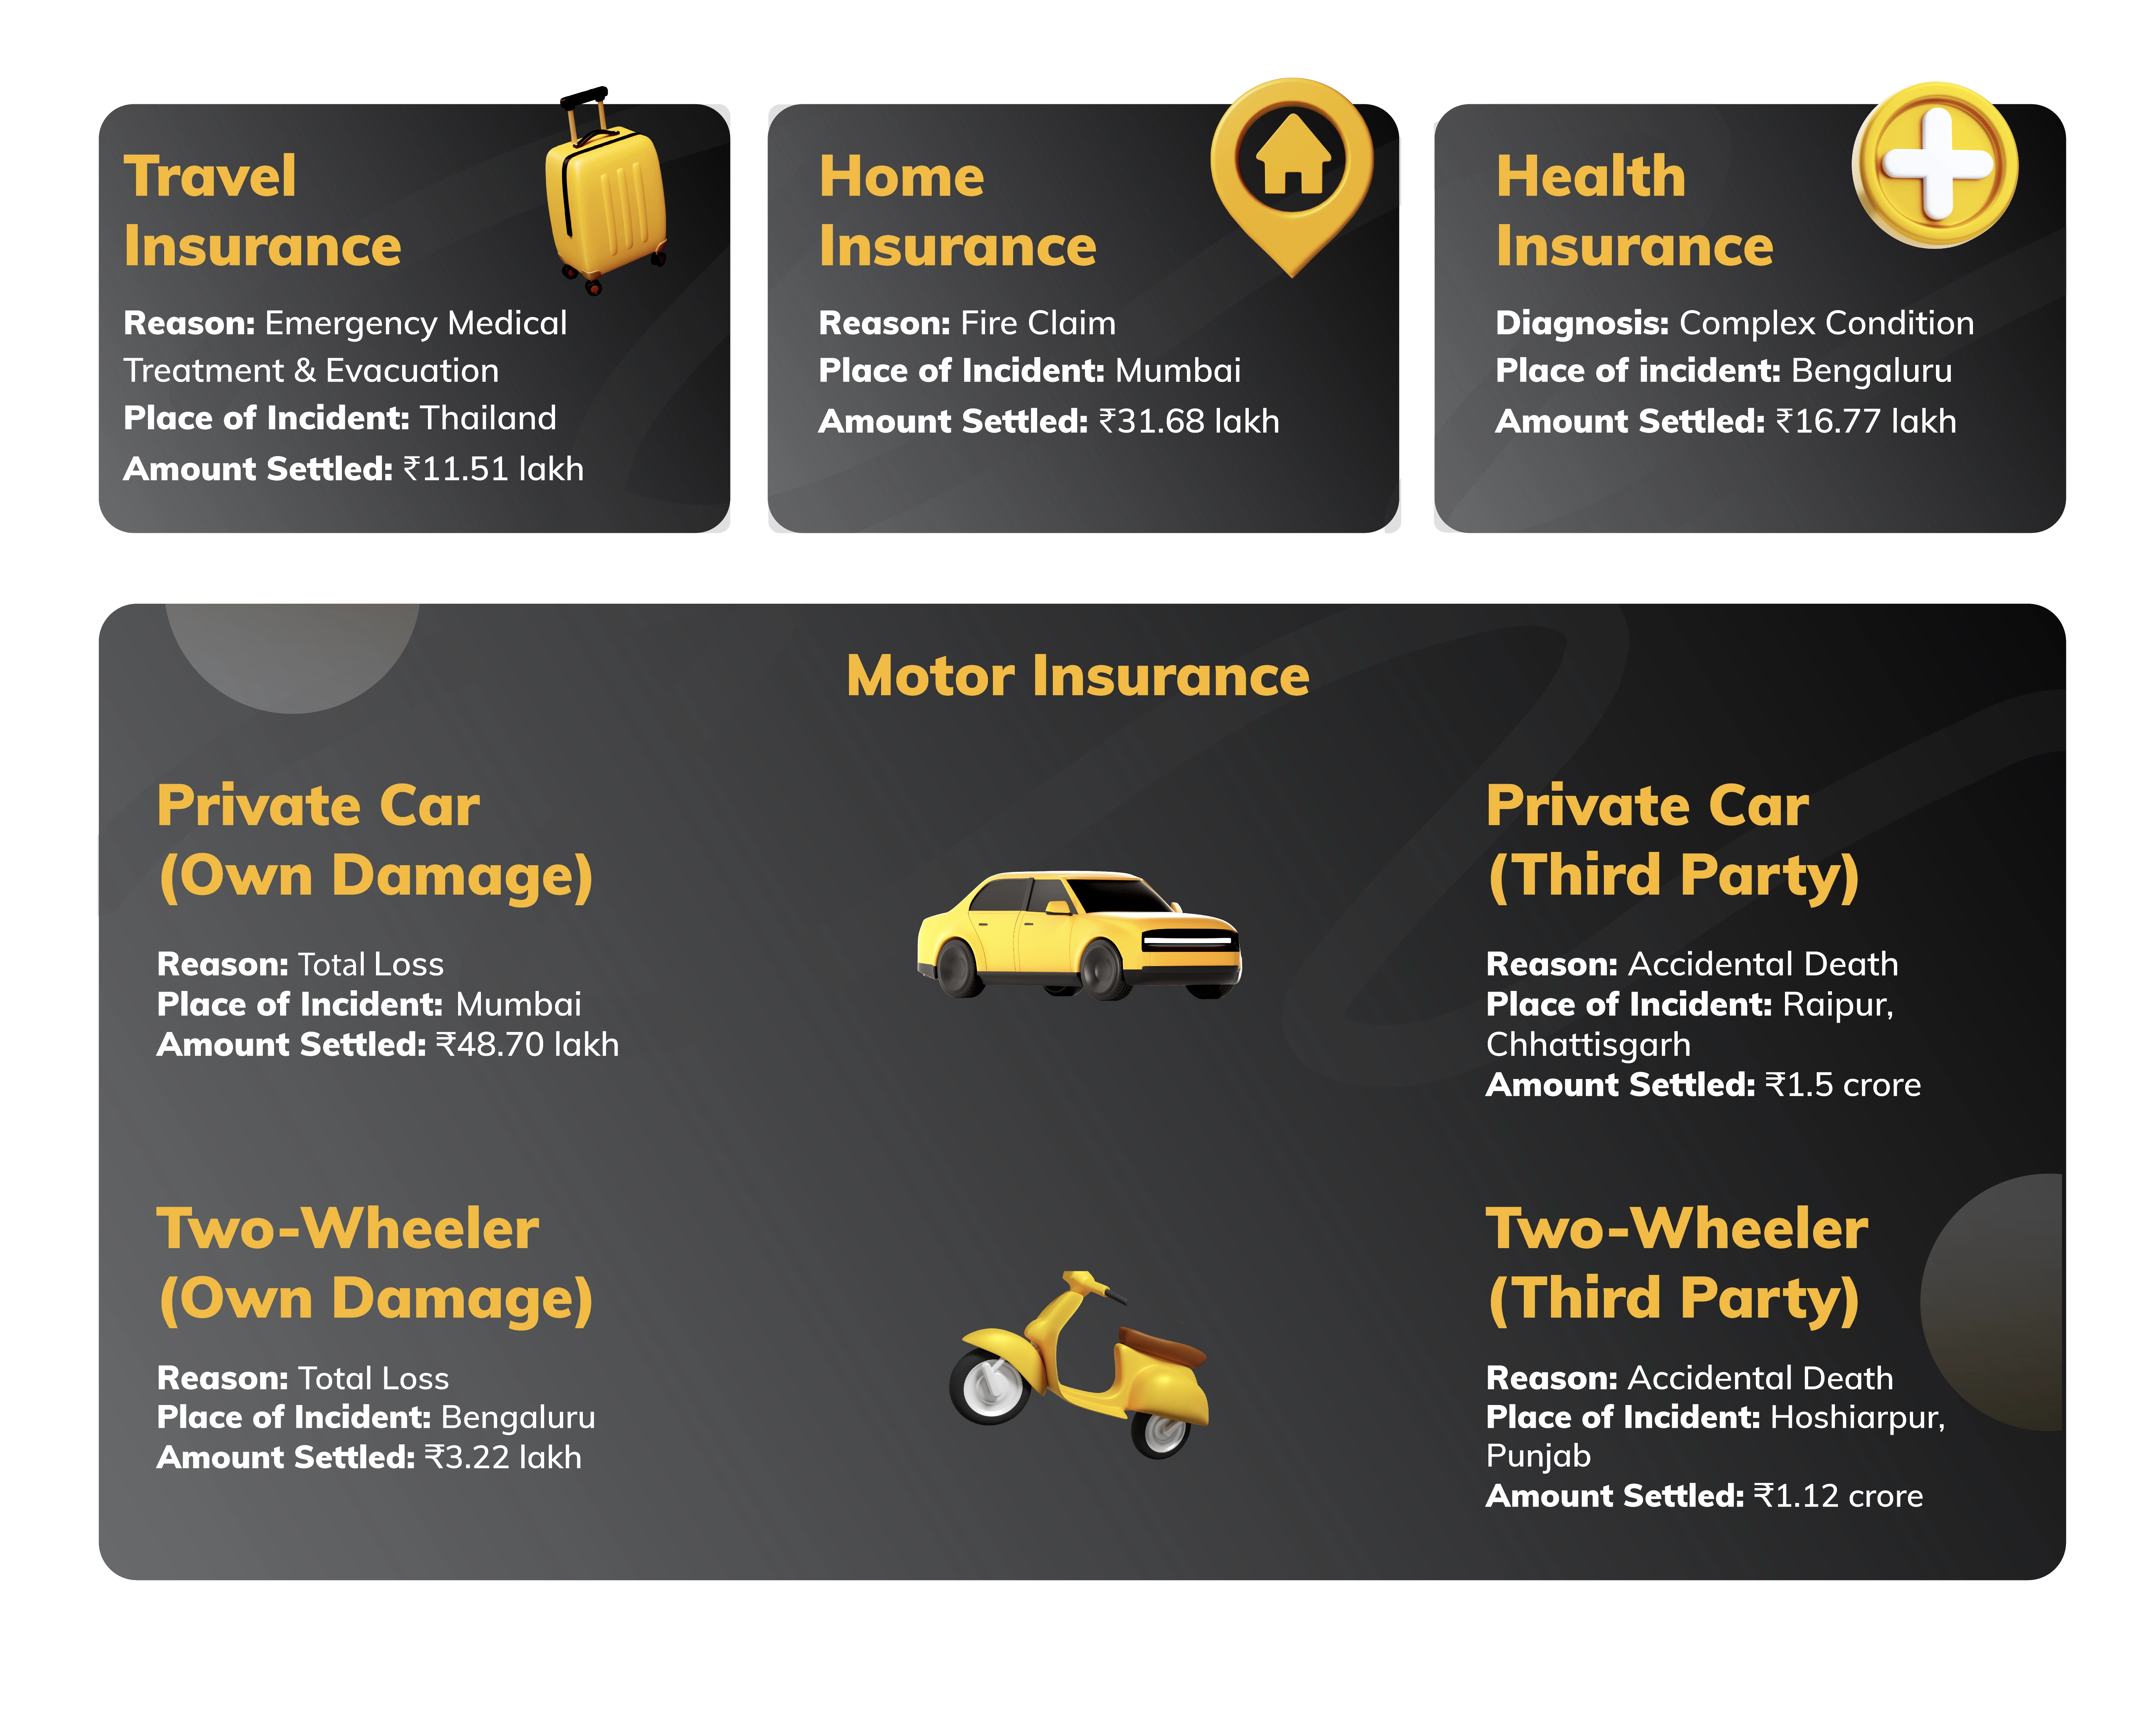
Something to ponder over: This data is also a reminder of how big some of the claims can be and how one needs to ensure to have adequate insurance coverage.
YOU CAN COUNT ON ME LIKE
Another thing that adds to the Trust-ometer of any company going up is showing how reliant and accessible they can be in times of need. That feeling of reliability, that unwavering presence – that's the essence of trust, isn't it? That's the kind of reliable presence we strive for.
To ensure you always know what’s happening, over the years, we have focused on our self-servicing model through WhatsApp. Through our WhatsApp bot, you can get update on various things—from renewals to claims, and much more! To be honest, our aim is to ensure you get information on your fingertips; you never have to spend time calling us and are always updated! 😊
CAN YOU DROP ME A HI! ON WHATSAPP? 🙋♀️
We feel reaching out to us should be as simple as dropping us a Hi! on WhatsApp. And that’s why our WhatsApp bots process various services without you having to reach out to us directly.

| Month | No. Of Live Chats Handled | No. Of Customers Served | Customers Who Called After Using WhatsApp Service |
|---|---|---|---|
| Apr'24 | 7,824 | 50,542 | 31% |
| May'24 | 9,919 | 54,940 | 33% |
| Jun'24 | 9,901 | 1,01,267 | 30% |
| Jul'24 | 11,500 | 60,000 | 33% |
| Aug'24 | 17,043 | 70,657 | 31% |
| Sep'24 | 25,552 | 78,915 | 29% |
| Oct'24 | 24,615 | 77,046 | 30% |
| Nov'24 | 24,573 | 83,798 | 30% |
| Dec'24 | 24,329 | 81,846 | 28% |
| Jan'25 | 24,687 | 69,885 | 28% |
| Feb'25 | 22,866 | 59,579 | 29% |
| Mar'25 | 19,106 | 60,823 | 24% |
| Total | 2,21,915 | 8,49,298 | 29% |
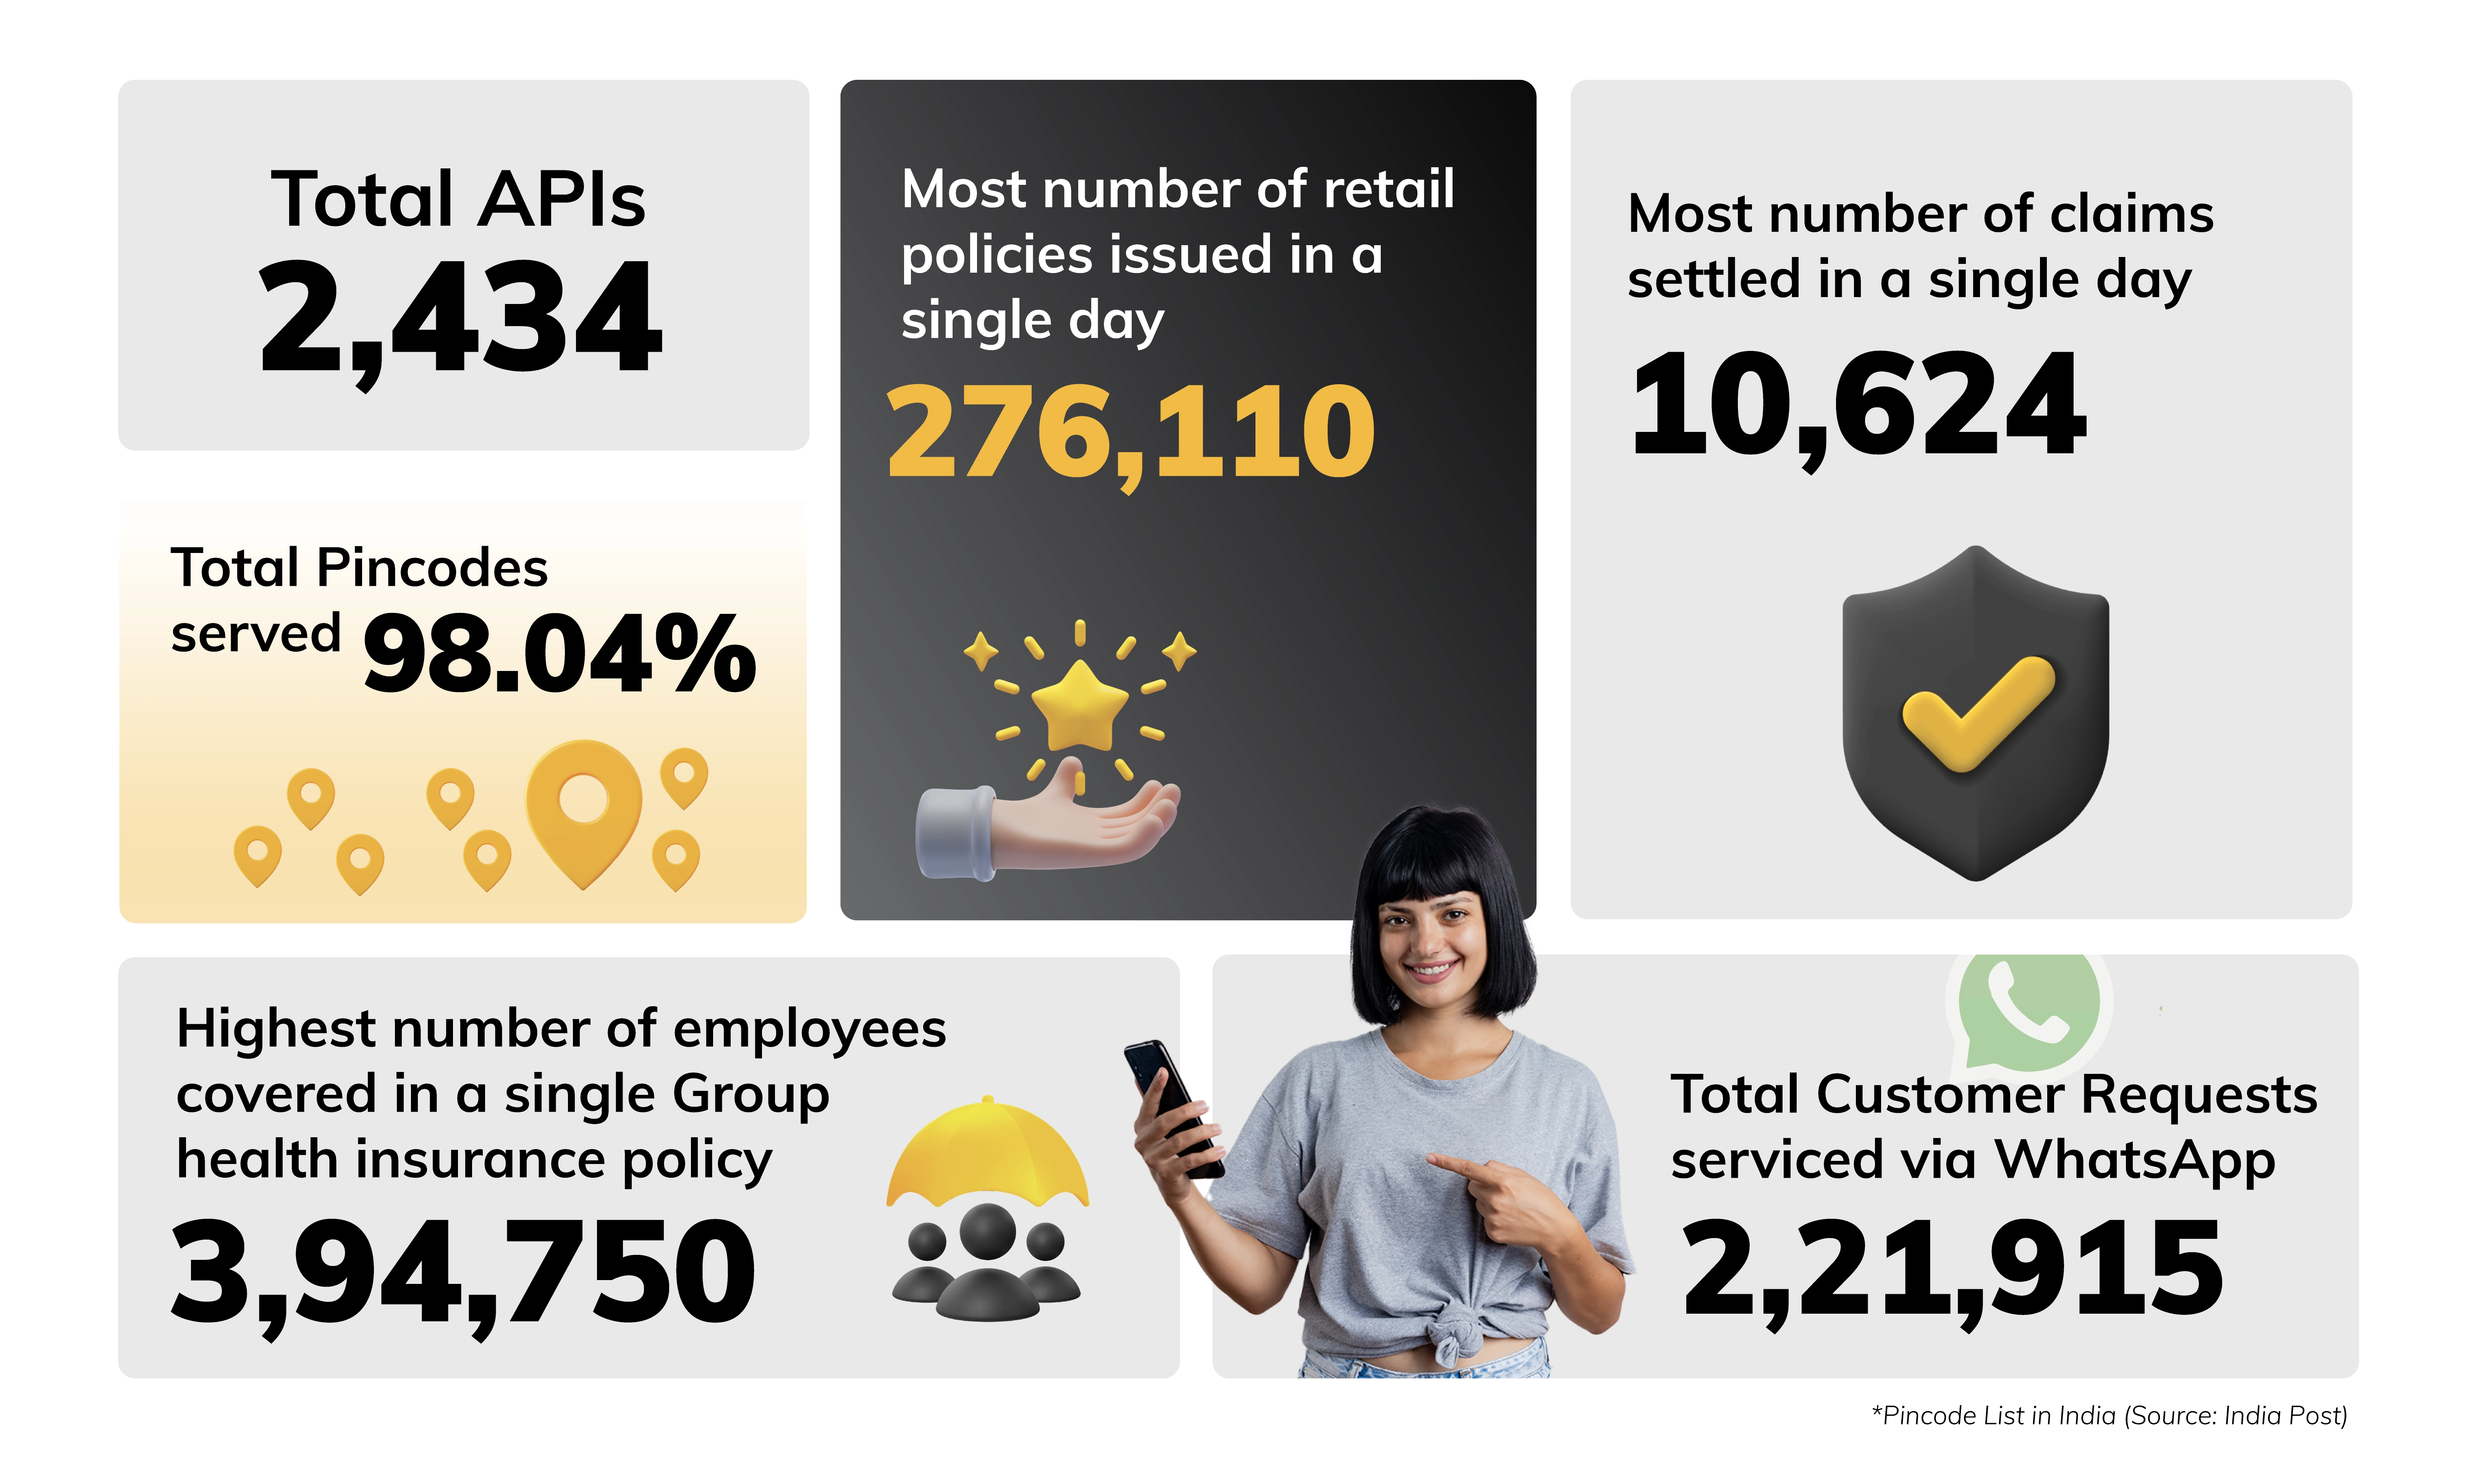
The Real Picture: In FY25, we served 8.49 lakh customers(an average of 2,327 customers per day) and handled 2.22 lakh live chats on WhatsApp. We received more than 2.04 lakh queries just to quickly fetch policy PDFs.
However, a high WhatsApp self-servicing number doesn’t mean people don’t call us at all. 29% of the customers who utilised our WhatsApp service still called our call centre to seek further clarifications. We still have some way to go before WhatsApp or app-only interaction becomes a complete reality.
That’s why our call centres are also fully prepared to handle all your requests swiftly. Let’s take a look:
TRUE CALLER: PICK IT UP, PICK IT UP, HELLO? 📞
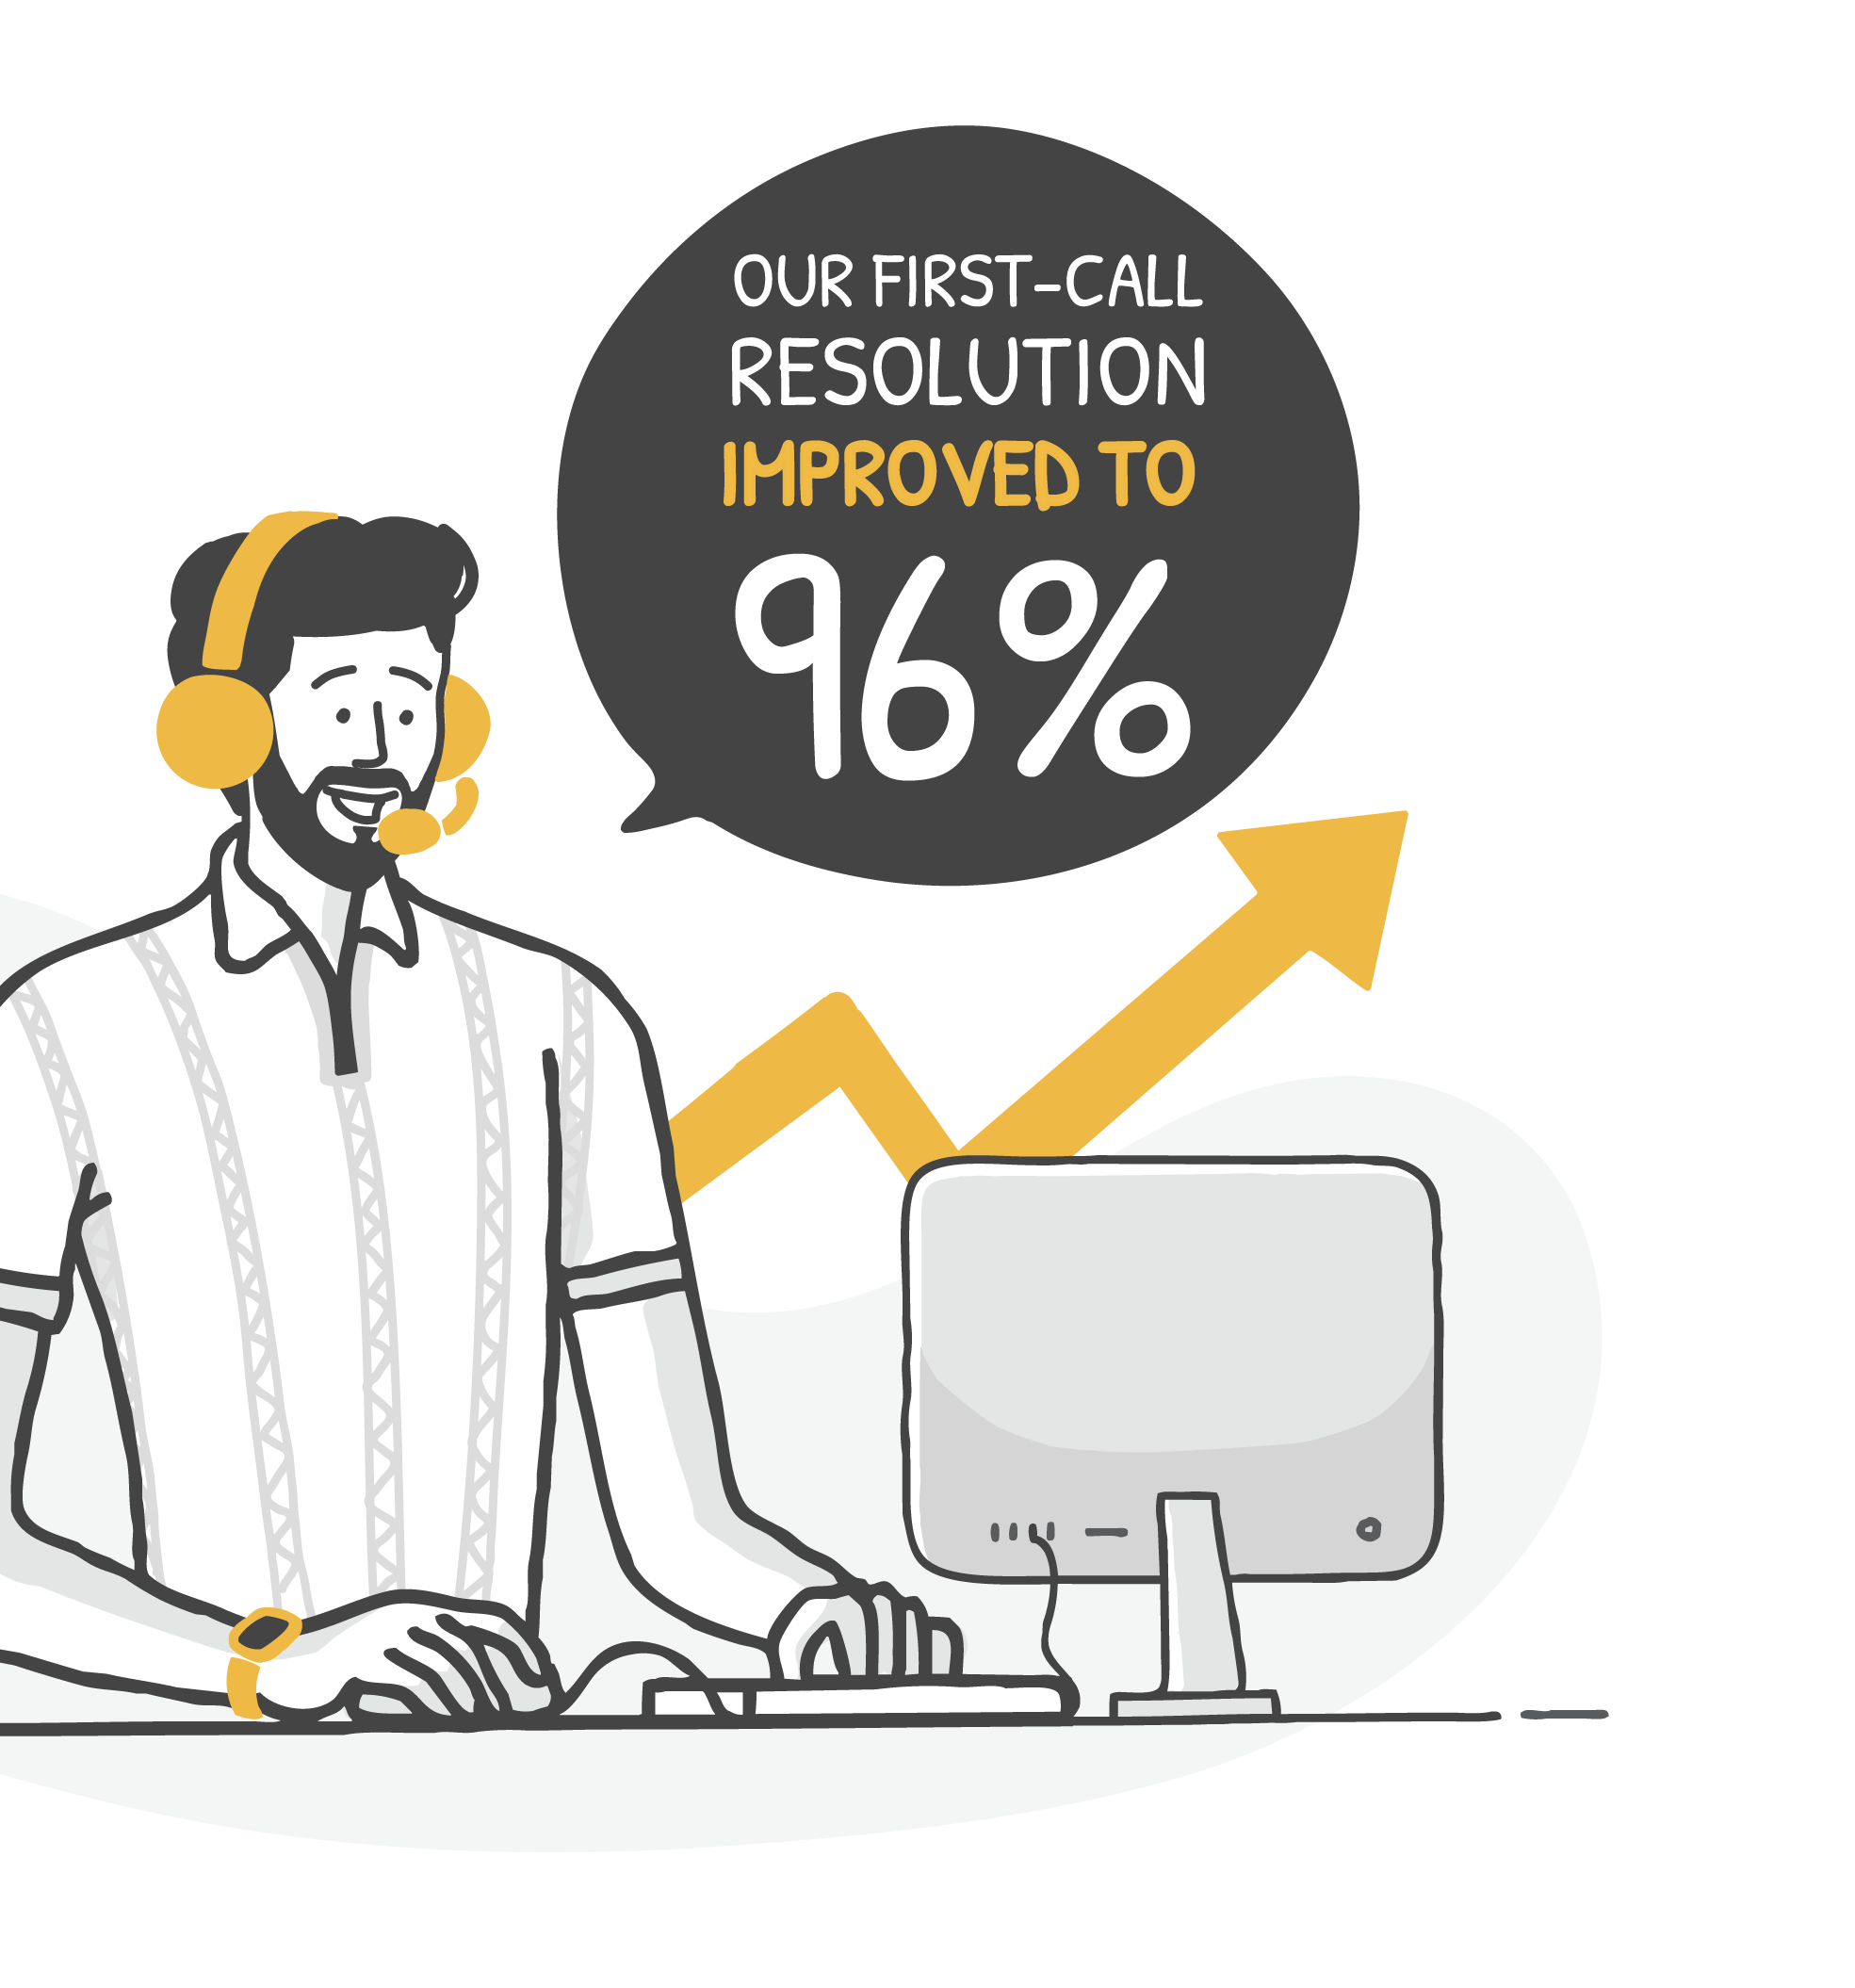
Our constant endeavour is to make sure we resolve everything for you in the first call and that’s why we consciously track this as a metric.
The Real Picture: In H2FY25, our first-time resolution (FTR) on the calls improved by 3%. In H2FY25, 96% of our customers (compared to 93% in H1FY25) received FTR on the calls, meaning 96% of them had their issues handled, actioned, and closed on the same call itself and they did not have to call us again.
| H1FY25 | H2FY25 | |
|---|---|---|
| 715,355 | Calls handled | 739,677 |
| 6 mins 52 secs | Average Talk Time | 5 mins, 58 secs |
| 673,803 | Service Requests | 864,095 |
| 2:24:02 | TAT (Hrs) | 1:54:08 |
| 93.00% | FTR: First-time resolution (in %) | 96.00% |
In FY 2024-25, we handled over 14.5 lakh calls. Our customer response started by being reactive. We then moved to proactive response and self-service model. Our aim is to now build a system that diminishes the need to call. While our systems are equipped to handle and efficiently manage high volume of calls, our aim is to make our self-service options so good that our call volume comes down by 25-30%.
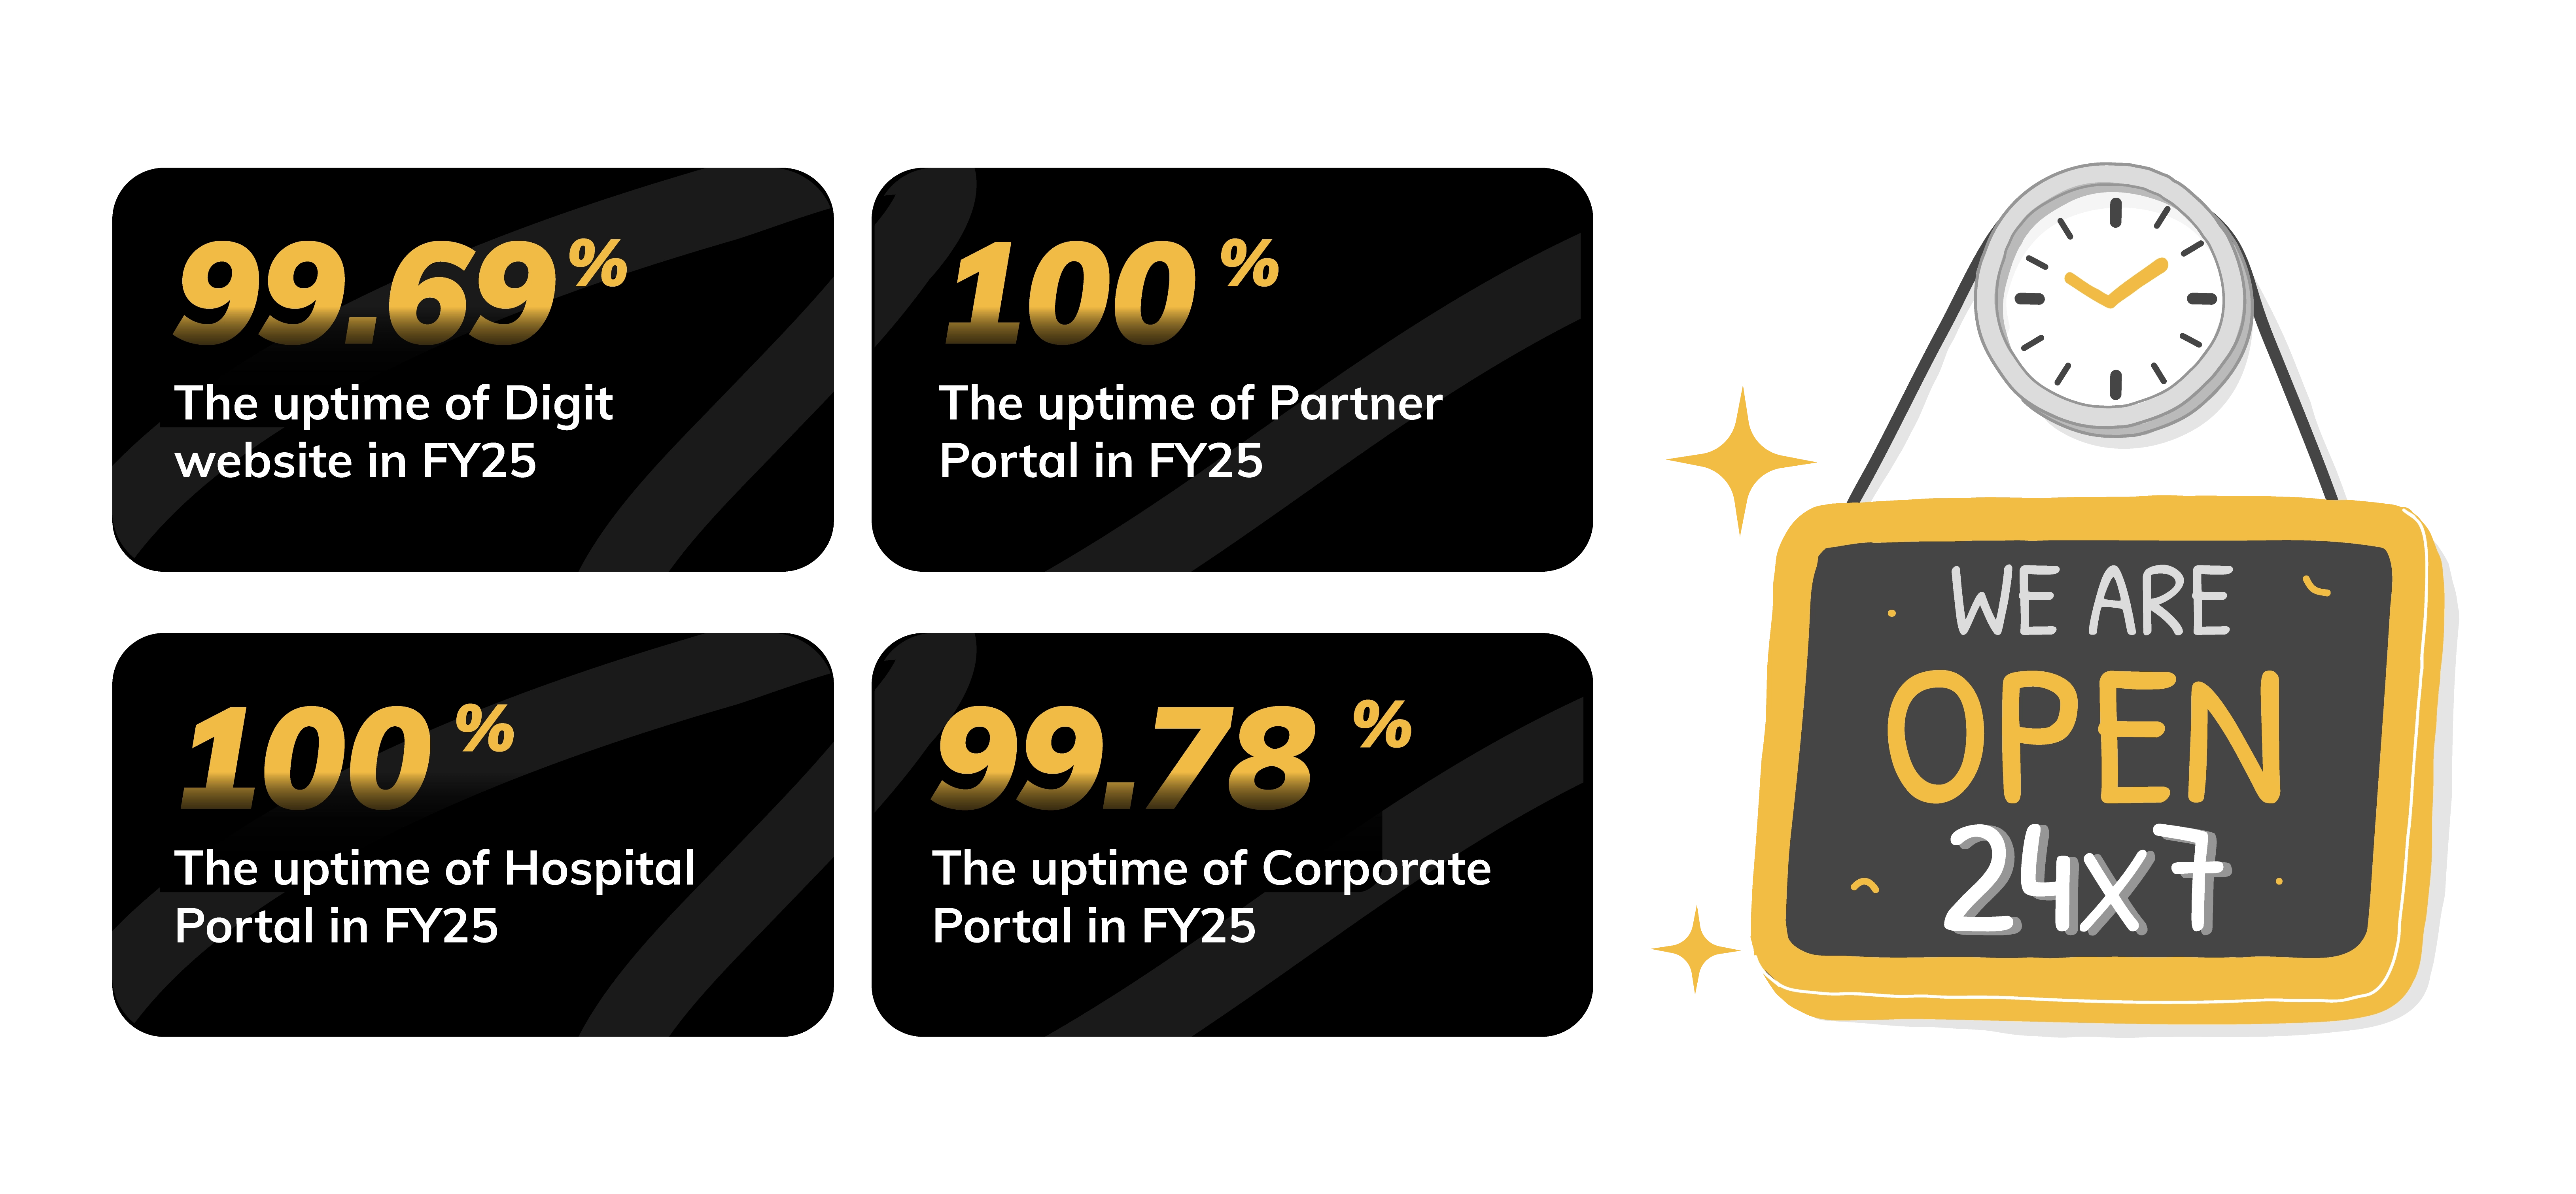
💡NO BLACKOUT: KEEPING THE LIGHTS ON 24X7
As a digital insurer, do we ever go offline? Insurance buying to claims settlement—everything happens 24x7, 365 days a year (yes, even on holidays) and we need to ensure our systems are always up online. So, here we are showing you our entire incident history across all our platforms—Digit website, partner portal, hospital portal and corporate portal. You can monitor this anytime by going to Digit's Status Page.
Stronger systems ensure smoother experiences and we focus constantly on providing you uninterrupted service. This is how we fared in FY 2024-25:
🚀 Total downtime hours reduced by more than 70% in the last 1 year.
🚀 Average Major Incidents reduced by around 40%.
🚀 Mean Time between two major Incidents or two major failures improved by 60%.
BUILDING BLOCKS OF TRUST:
HOW OUR TECH ENSURES SMOOTH CLAIMS PROCESS
In the last eight years, we have worked hard on building a strong foundation of trust by strategically leveraging technology to ensure a smooth and efficient experience for you when it matters most. Let’s show you some of the tech magic that happens behind the screens!
AUTOMATIC AI-BASED DATA ENTRY AND DOCUMENT CLASSIFICATION
When you submit hospital bills for settlement, we use AI to automate the processing of various documents (like medical bills, diagnostic reports, claim form, KYC documents, discharge summary, etc), reducing manual effort. With human-in-the-loop approach, we ensure accuracy, resulting in faster claim settlements and fewer errors.
In FY25, our AI models processed over 2 lakh unique claims requests and classified 19.76 lakh unique documents.
FAST TRACK KYC
Since KYC became mandatory for insurance in January 2023, our Fast Track KYC ensures a quicker process for existing Digit customers. If your information is already on file, you'll get a prompt to reuse it in case there are no changes, speeding up policy issuance and making the buying process smoother.*
In FY 2024, 25, we processed nearly 1 crore KYCs, out of which 8.18 lakh were enabled smoothly through fast-track mode.
Note: * Customers have the option to complete KYC process afresh in case there have been any changes
USING AUTOMATION FOR CLAIMS REGISTRATION
Automation has transformed our operations at Digit, with initiatives like Bulk Policy Issuance and Health Claims Bots. These bots fetch claim information directly from partner systems, reducing manual data transfer, minimizing errors, and speeding up the process for faster claim settlements.
During the year, our bots registered 1.1 lakh claims through this automation process.
DIGIT STORIES
HOW WE COVERED FY2025

1.
This year we covered a total of around 7,747 babies with their parents’ Digit policies.
Most common baby names covered
by Digit:
Boys: Shivansh
Girls: Fatima
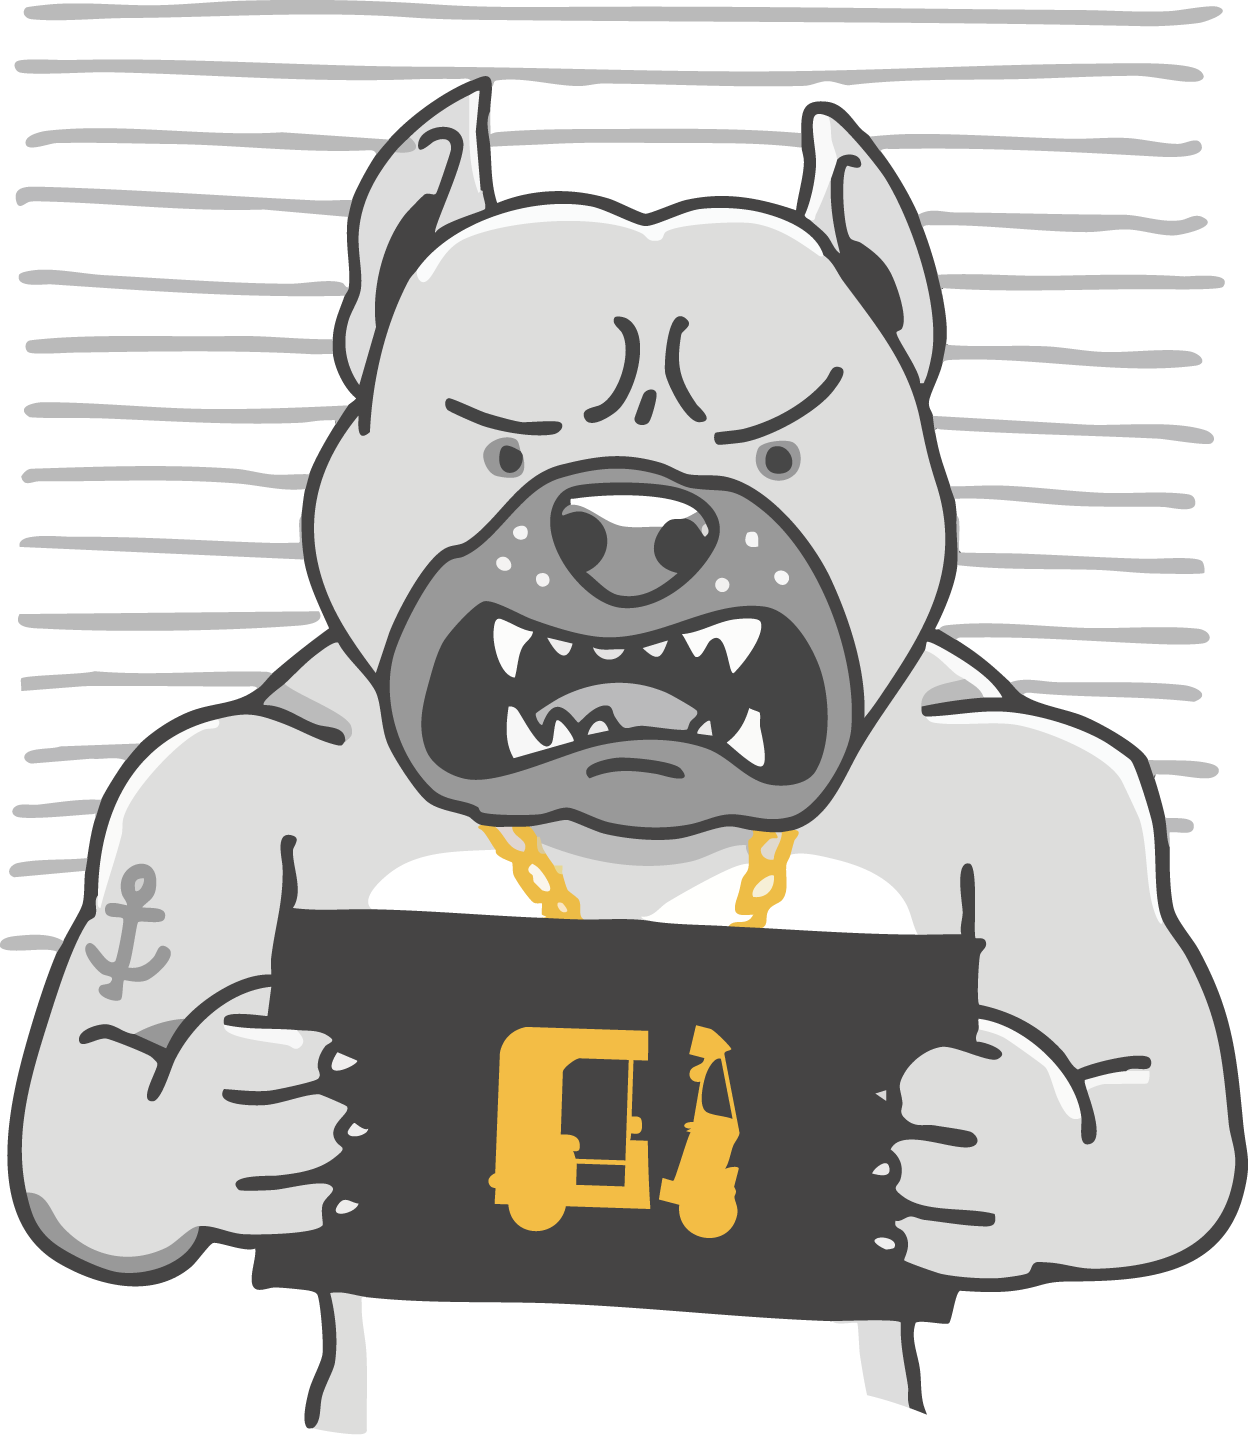
2.
This year, dogs caused the most trouble for autos in Panvel area in Raigad. More than ₹1.5 lakh was spent on autos to fix various damages.
3.
Straight out of a Rohit Shetty movie:
A JCB flipped over in a somersault when a cow came in front of it, leading to a claim of more than ₹4 lakh.
4.
In FY25, we paid over ₹95 crore in claims for flood and inundation damages with the highest number of claims—529—reported from Azitnagar in Krishna district near Vijayawada where we paid more than ₹3 crore.

5.
Rat menace: A customer from Surat filed a claim twice in a year for his EV bike. The culprit both times? Wire harness being cut by the rat while bike was parked at home!

06.
This year, we paid more than ₹27 crore as part of pre- and post-hospitalization costs in health insurance. Over ₹1.4 lakh was paid for a patient with malignancy, covering 10 different pre- and post-hospital visits
07.
Our call centre representatives collectively attended calls worth more than 18 years. Our average queue wait time for incoming calls was just 13 seconds with more than 80% of the calls having zero queue wait time.
08.
We received more than 2.04 lakh queries on WhatsApp for policy PDF details.
09.
Unluckiest Customer: Mr X from Patna was probably our unluckiest customer this year. His new Kia Carens had 7 accidents during the year—6 of them while driving and 1 while being parked.
10.
So posh! In motor insurance, we received the highest premiums for a Ferrari four-wheeler at ₹8.04 lakh, a Hayabusa two-wheeler at ₹44,000, and a Volvo L150 wheel loader commercial vehicle at ₹3.53 lakh.
11.
This year, we insured 670+ vehicles with fancy Bond registration number 007, with a customer paying as high as ₹5 lakh as premium
12.
The share of BSVI-compliant vehicles (39%) became more than BSIV-compliant ones (36.46%).
WHAT OUR NUMBERS LOOKED LIKE IN FY 2024-25
Before we wind up, let's take a quick look at our Financials and Growth Numbers. You can find all our key numbers here: https://www.godigit.com/investor-relations
CROSSING ₹10,000 CRORE IN REVENUE WITHIN 7 FULL YEARS OF OPERATION, AND MORE!
| FY 2023-24 | FY 2024-25 | |
|---|---|---|
| Gross Written Premium | ₹ 9,016 crore | ₹ 10,282 crore |
| Number of Policies Sold | 11.1 million | 12 million |
| Total Customers Served^ | 47.1 million | 67 million |
| Total Claims Settled^ | 2.0 million | 2.94 million |
| Premium Growth | 24.5% | 14.04% |
| Profit After Tax (PAT) | ₹ 1.82 billion | ₹ 4.25 billion |
Data for the period FY2024 and FY2025; *Cumulative count of all customers/lives onboarded and includes without limitation persons who have availed insurance benefits under various policies since inception. ^ Claims settled since inception.
CAPTURING OUR GROWTH NUMBERS IN FY 2024-25
It's time to say goodbye. We hope you enjoyed reading our Transparency Report—a quick 9-minute ride.
Hit us up at mediarelations@godigit.com. Tell us what vibed, what didn’t, or what you would want next.
We will be back with our next drop in October. Until then, take care!
